Q1 2026 Billing Performance Review: Al Wusta Region

Generated from prompt:

I WANT TO MAKE A PRESANTATION ON Q1 ALWUSTA REIGON

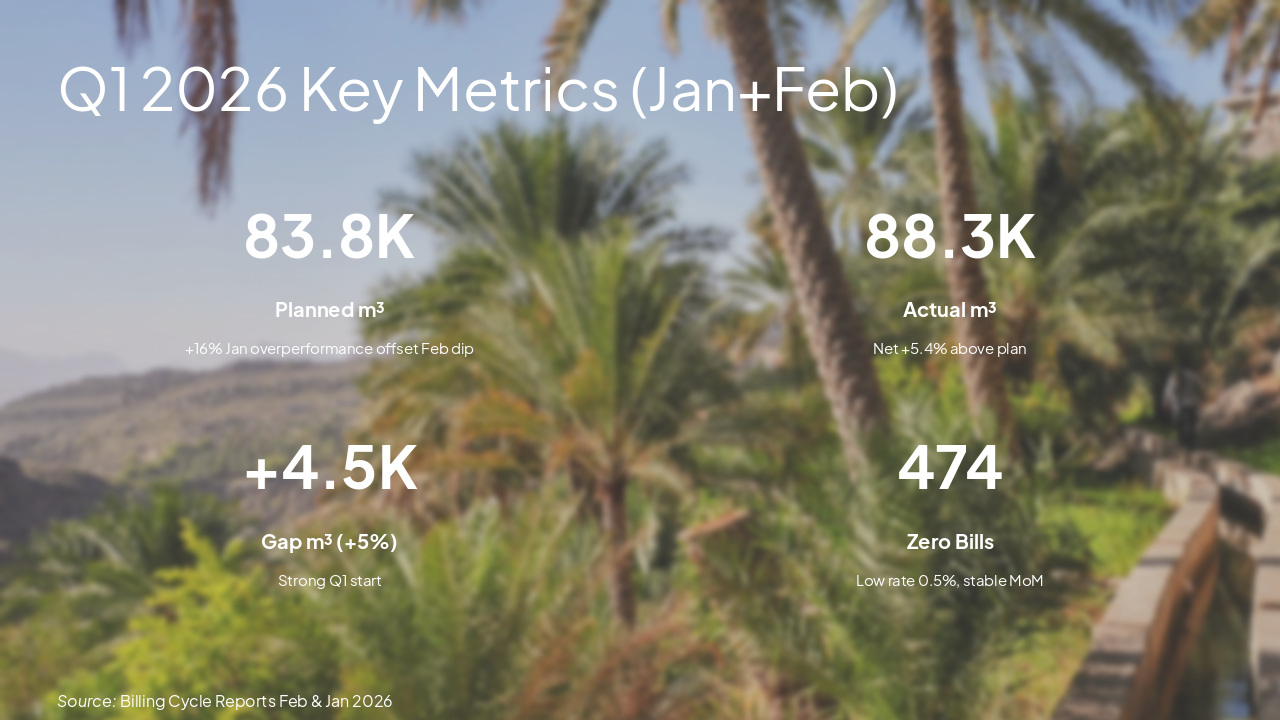
This presentation analyzes Q1 2026 billing performance for Al Wusta Governorate in Oman Water Utility, based on January and February cycle reports. It includes a region overview highlighting its size, low billing base, and stable operations; key metrics showing net +5.4% above planned volumes (88.3K m³ actual vs. 83.8K planned); monthly breakdowns (Jan +16%, Feb -5%); low zero bills (0.5% rate, lowest in Oman); key issues like faulty meters; challenges and recommendations for sustaining performance; and key takeaways positioning Al Wusta as a model for stability.

May 11, 20269 slides
Slide 1 of 9

Slide 1 - Q1 Billing Performance Al Wusta Region

Q1 Billing Performance Al Wusta Region

Insights from Jan-Feb 2026 Cycle Reports | Oman Water Utility

---

Photo by Alan Carrillo on Unsplash

Slide 1 - Q1 Billing Performance
Al Wusta Region
Slide 2 of 9

Slide 2 - Presentation Agenda

  • Region Overview
  • Q1 Key Metrics
  • January Performance
  • February Performance
  • Zero Bills & Issues
  • Challenges & Recommendations
  • Conclusion

---

Photo by Andrew Svk on Unsplash

Slide 2 - Presentation Agenda
Slide 3 of 9

Slide 3 - Region Overview

1

Region Overview

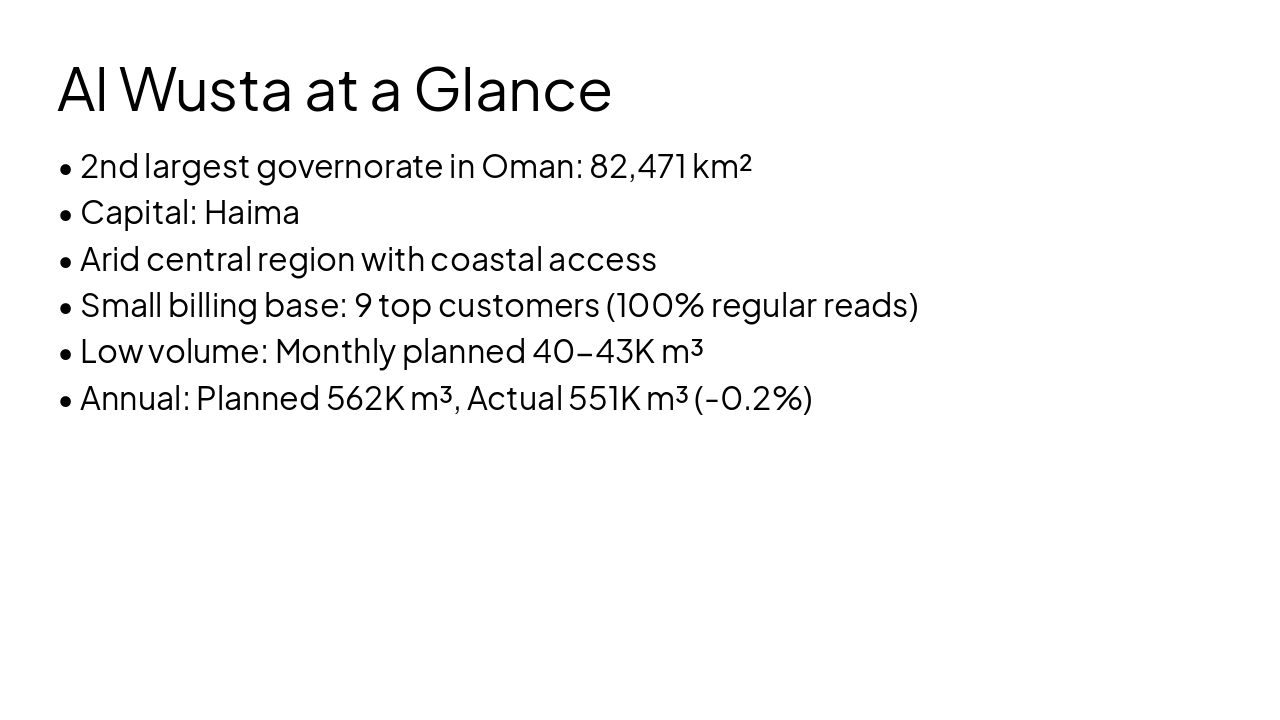
Al Wusta Governorate: 82,471 km², Central Oman, Capital Haima (Wikipedia & Billing Reports)

---

Photo by Justinas Bolys on Unsplash

Slide 3 - Region Overview
Slide 4 of 9

Slide 4 - Al Wusta at a Glance

  • 2nd largest governorate in Oman: 82,471 km²
  • Capital: Haima
  • Arid central region with coastal access
  • Small billing base: 9 top customers (100% regular reads)
  • Low volume: Monthly planned 40-43K m³
  • Annual: Planned 562K m³, Actual 551K m³ (-0.2%)
Slide 4 - Al Wusta at a Glance
Slide 5 of 9

Slide 5 - Q1 2026 Key Metrics (Jan+Feb)

  • 83.8K: Planned m³
  • 88.3K: Actual m³
  • +4.5K: Gap m³ (+5%)
  • 474: Zero Bills

---

Photo by Andy Arbeit on Unsplash

Source: Billing Cycle Reports Feb & Jan 2026
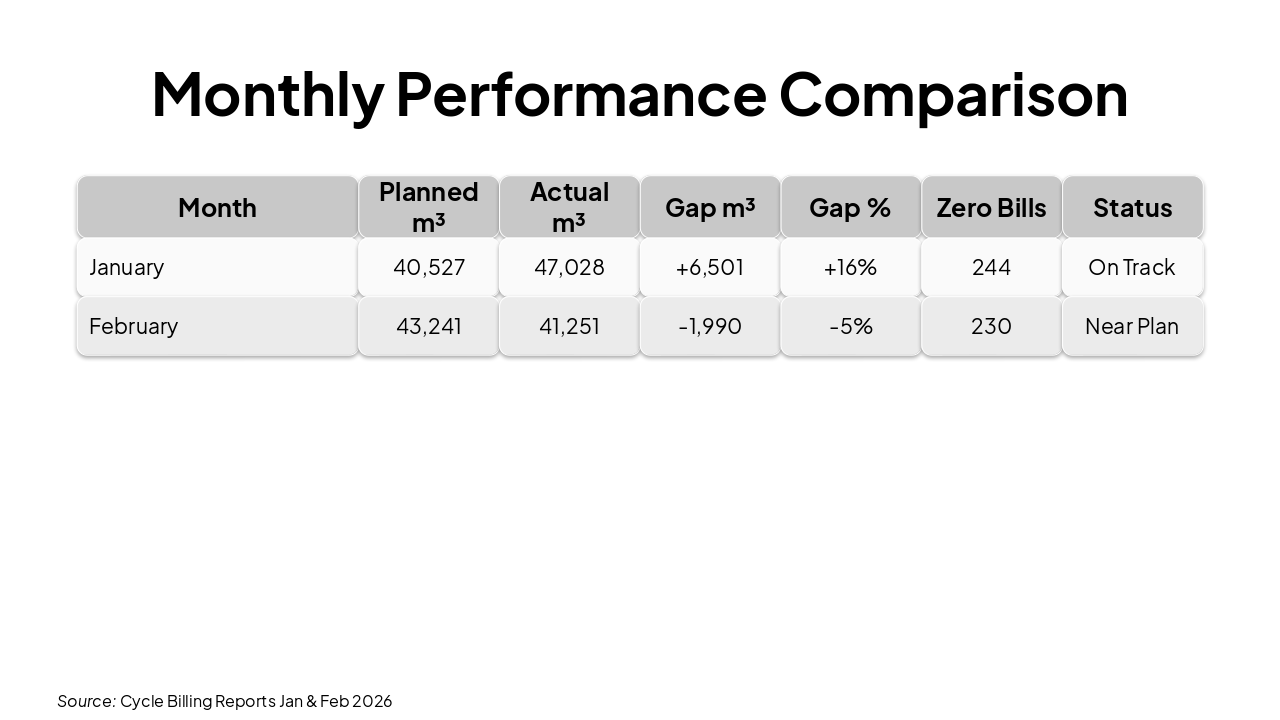
Slide 5 - Q1 2026 Key Metrics (Jan+Feb)
Slide 6 of 9

Slide 6 - Monthly Performance Comparison

MonthPlanned m³Actual m³Gap m³Gap %Zero BillsStatus
January40,52747,028+6,501+16%244On Track
February43,24141,251-1,990-5%230Near Plan

Source: Cycle Billing Reports Jan & Feb 2026

Slide 6 - Monthly Performance Comparison
Slide 7 of 9

Slide 7 - Zero Bills & Key Issues

  • Zero Bills: 244 (Jan) → 230 (Feb), 0.2% of total (lowest region)
  • Faulty Meters: 6
  • Illegal Connections: 0
  • Top Customers: 228 accounts, 100% regular reads (9 detailed: 0% estimates)
  • Low risk: Consistent near-plan performance
  • Stable MoM trends despite overall Oman challenges

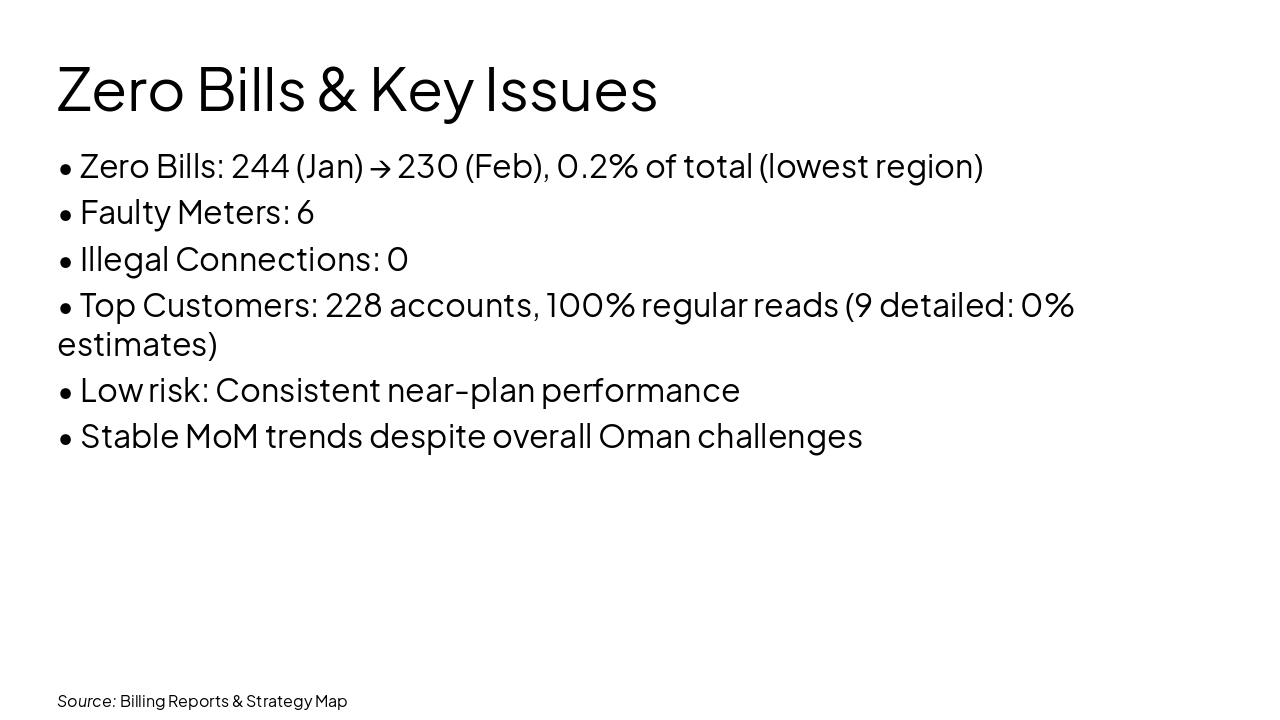
Source: Billing Reports & Strategy Map

Slide 7 - Zero Bills & Key Issues
Slide 8 of 9

Slide 8 - Challenges & Recommendations

  • Minor Feb shortfall (-5%): Field verification needed
  • Maintain low zero bills (0.5% rate)
  • Replace 6 faulty meters promptly (7-14 days)
  • 100% regular top customer billing: Continue monitoring
  • Scale best practices: Consistent reads despite small base
  • Target: Stay 'Near Plan' through Q2
Slide 8 - Challenges & Recommendations
Slide 9 of 9

Slide 9 - Key Takeaways & Next Steps

Al Wusta: Q1 Net +5.4% Above Plan Lowest Zero Bills (0.2% of Total) Model Region for Stability

Next: Sustain reads, fix faulty meters, monitor top customers | Thank you! Questions?

---

Photo by Bobby on Unsplash

Slide 9 - Key Takeaways & Next Steps

Discover More Presentations

Explore thousands of AI-generated presentations for inspiration

Browse Presentations
Powered by AI

Create Your Own Presentation

Generate professional presentations in seconds with Karaf's AI. Customize this presentation or start from scratch.

Create New Presentation

Powered by Karaf.ai — AI-Powered Presentation Generator