Slide 1 of 6
Slide 1 - Customer Brand Switching in the Soft Drink Market
Customer Brand Switching in the Soft Drink Market
Analyzing Coke, Pepsi, and Store Brand with Markov Chain Model and Transition Matrix

Generated from prompt:
Create a 6-slide PowerPoint presentation for an engineering student on the topic: 'Customer Brand Switching in the Soft Drink Market (Coke vs Pepsi vs Store Brand) using Markov Chain Model and Transition Matrix'. The presentation should include: 1) Title slide, 2) Introduction to brand switching, 3) Explanation of Markov Chain Model, 4) Transition matrix concept and example with Coke, Pepsi, and Store Brand, 5) Analysis and interpretation of switching probabilities, 6) Conclusion and implications for marketing strategy. The tone should be professional, clear, and academic, formatted as a human would make in Microsoft PowerPoint with visuals, concise text, and charts where appropriate.
This 6-slide PPT introduces brand switching in the soft drink market using Markov Chain models. It covers concepts, transition matrices with examples for Coke, Pepsi, and store brands, analyzes switch
Customer Brand Switching in the Soft Drink Market
Analyzing Coke, Pepsi, and Store Brand with Markov Chain Model and Transition Matrix
Brand switching in the soft drink market refers to consumers shifting preferences between brands like Coke, Pepsi, and store options, driven by factors such as price, taste, and marketing. This dynamic behavior stems from moderate loyalty, resulting in fluctuating market shares, and understanding it helps predict consumer actions and refine marketing strategies.
Markov Chains model sequences where the future state depends solely on the current state, known as the Markov property. In brand switching analysis, states represent brands like Coke, Pepsi, or Store Brand, with transitions showing switching probabilities, assuming a stationary process for long-term market insights.

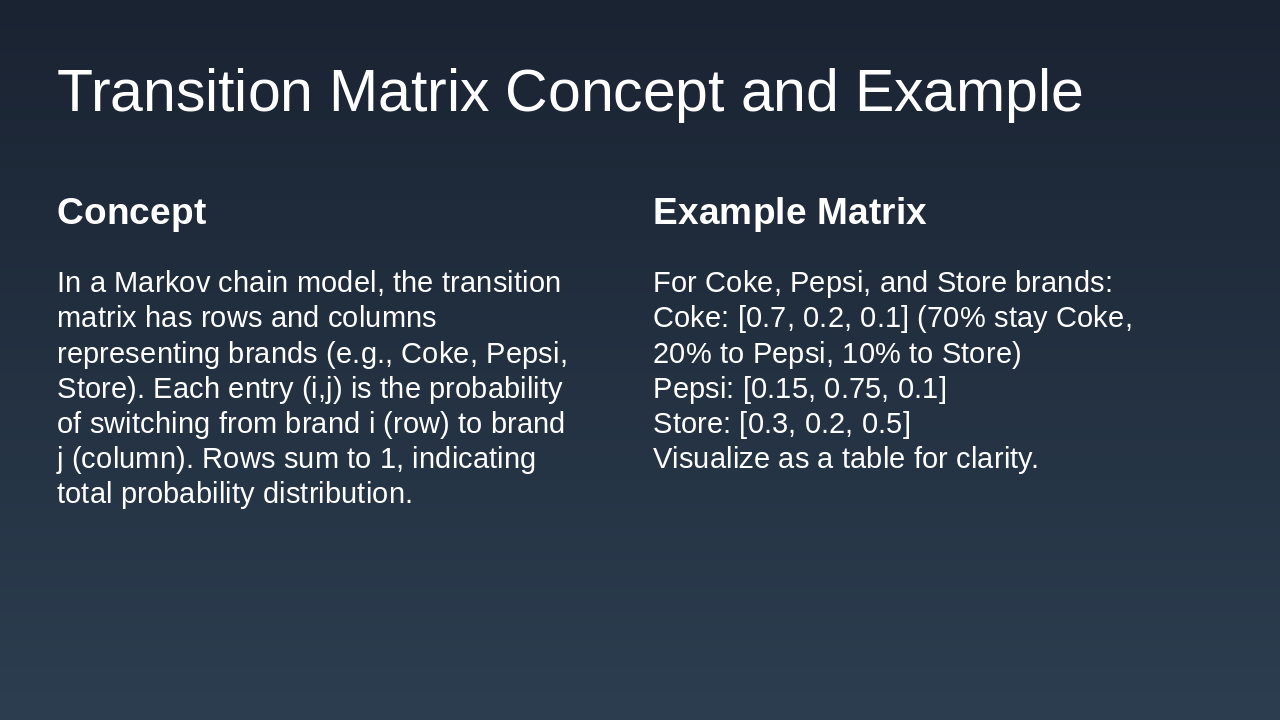
The slide explains the concept of a transition matrix in Markov chain models, where rows and columns represent brands like Coke, Pepsi, and Store, with each entry (i,j) denoting the probability of switching from brand i to brand j, and rows summing to 1 for complete probability distribution. It provides a concrete example matrix: Coke stays at 70% with 20% to Pepsi and 10% to Store; Pepsi at 75% stay with 15% to Coke and 10% to Store; Store at 50% stay with 30% to Coke and 20% to Pepsi, suggesting visualization as a table.
| Concept | Example Matrix |
|---|
| In a Markov chain model, the transition matrix has rows and columns representing brands (e.g., Coke, Pepsi, Store). Each entry (i,j) is the probability of switching from brand i (row) to brand j (column). Rows sum to 1, indicating total probability distribution. | For Coke, Pepsi, and Store brands: Coke: [0.7, 0.2, 0.1] (70% stay Coke, 20% to Pepsi, 10% to Store) Pepsi: [0.15, 0.75, 0.1] Store: [0.3, 0.2, 0.5] Visualize as a table for clarity. |
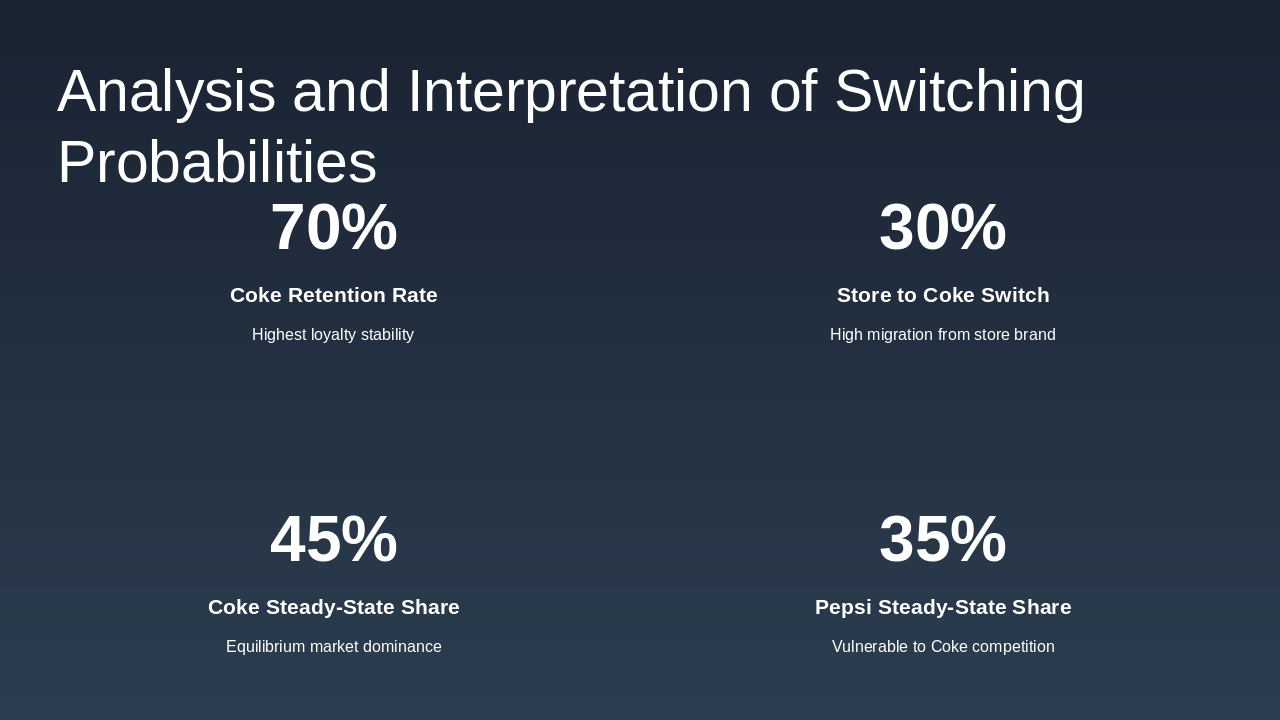
The slide analyzes switching probabilities in the cola market, highlighting Coke's 70% retention rate as the highest loyalty stability and a 30% switch rate from store brands to Coke. It also details steady-state market shares, with Coke at 45% indicating equilibrium dominance and Pepsi at 35% showing vulnerability to competition.
Highest loyalty stability
High migration from store brand
Equilibrium market dominance
Vulnerable to Coke competition
Markov models reveal customer switching patterns to enable precise forecasting, with strategies including bolstering loyalty for Coke, using ads to counter Pepsi, and emphasizing pricing for Store Brand retention. The slide highlights future enhancements via time-varying transitions, key takeaways on forecasting and research, and urges applying these insights for strategic marketing success.
• Markov models uncover switching patterns for accurate forecasting.
Key Takeaways: [Icons for Forecasting, Strategies, Future Research]
Closing Message: Insights drive strategic marketing success. Call-to-Action: Apply these models to optimize your brand strategy today.
Source: Customer Brand Switching Analysis using Markov Chains

Explore thousands of AI-generated presentations for inspiration
Generate professional presentations in seconds with Karaf's AI. Customize this presentation or start from scratch.