GreenRetail CO₂ Reduction Plan 2025-2028 (38 chars)

Generated from prompt:

GreenRetail – Nachhaltigkeitsmaßnahmen-Portfolio CO₂-Reduktion 2025–2028 Business presentation for a regional retail chain in Bavaria with 18 stores and 280 employees. Goal: −40% CO₂ (Scope 1+2) by 2028 | Budget: €250,000 | Measures: energy, refrigeration, packaging, customer experience. Style: Green Sustainability – professional, factual, TÜV-style layout, no greenwashing. Include slides for: 1. Title & Objectives 2. Company profile, current CO₂ baseline, and targets 3. Six measures overview (A–F: Ökostrom, LED, Kühlmöbel, PV, Ladesäulen, Mehrweg) 4. Evaluation logic & criteria 5. Cost-benefit & scoring matrix 6. Prioritization of measures 7. Scenario A – Maximum CO₂ impact 8. Scenario B – Quick visible wins 9. Scenario C – Customer impact 10. Roadmap 2025–2027 (Scenario A) 11. Risks & dependencies 12. Conclusion & next steps Tone: fact-based, visual, data-driven, suitable for management presentation

Presentation for Bavarian retail chain (18 stores, 280 staff) targeting -40% CO₂ (Scope 1+2) by 2028 with €250k budget. Covers profile, 6 measures (Ökostrom to Mehrweg), evaluation matrix, prioritizat

December 9, 202512 slides
Slide 1 of 12

Slide 1 - GreenRetail – Nachhaltigkeitsmaßnahmen-Portfolio CO₂-Reduktion 2025–2028

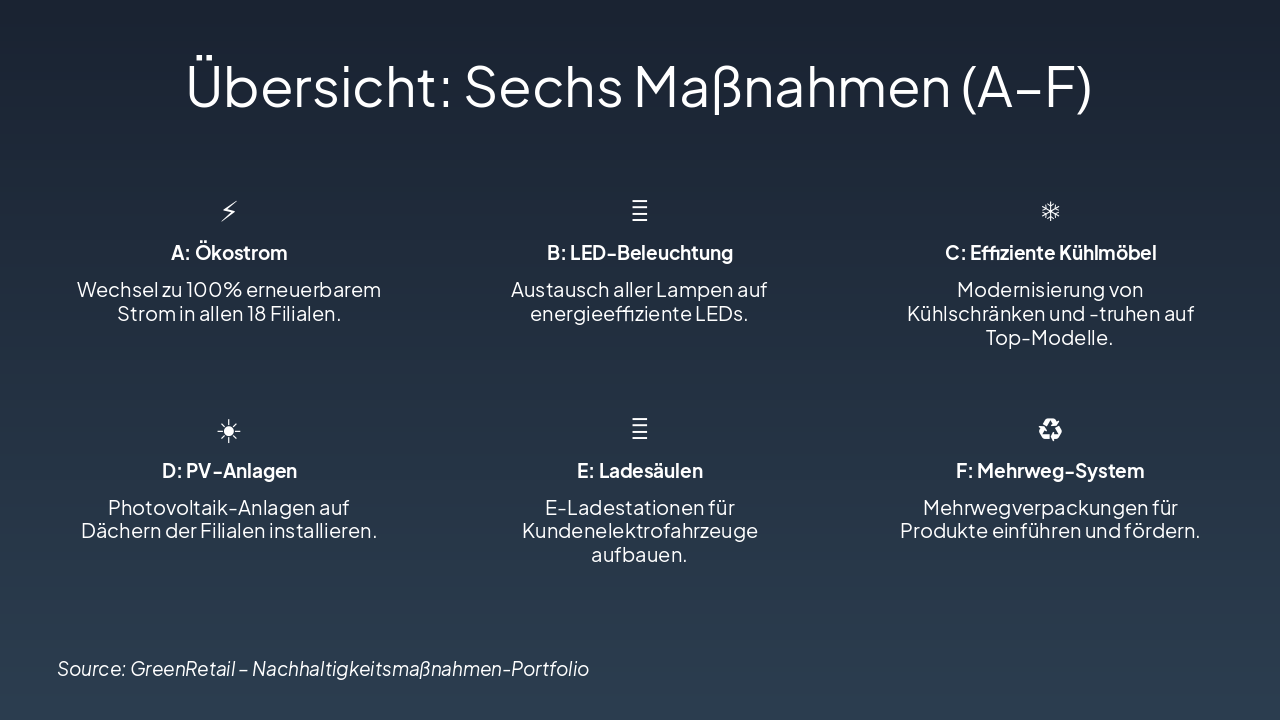
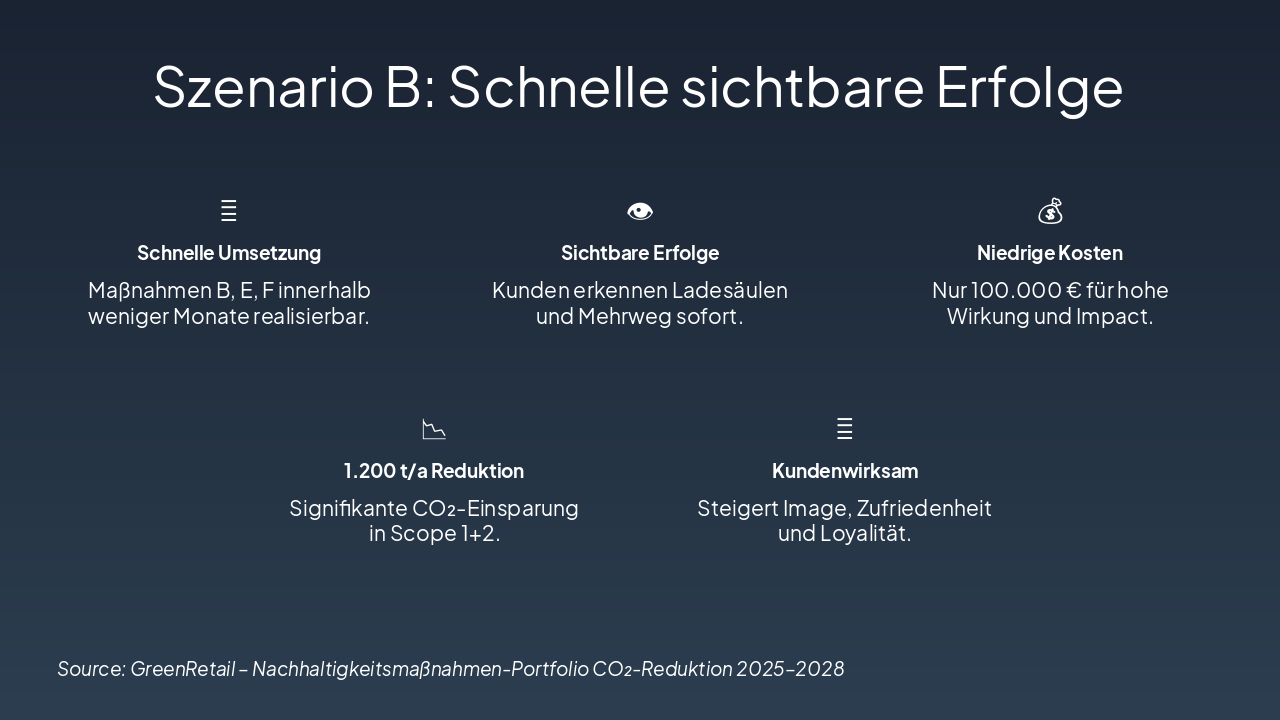
This title slide presents the GreenRetail Sustainability Measures Portfolio for CO₂ reduction from 2025 to 2028. It specifies a target of −40% CO₂ emissions (Scope 1+2) by 2028, with a budget of €250,000.

GreenRetail – Nachhaltigkeitsmaßnahmen-Portfolio CO₂-Reduktion 2025–2028

Ziel: −40% CO₂ (Scope 1+2) bis 2028 | Budget: €250.000

Slide 1 - GreenRetail – Nachhaltigkeitsmaßnahmen-Portfolio CO₂-Reduktion 2025–2028
Slide 2 of 12

Slide 2 - Unternehmensprofil, CO₂-Basislinie & Ziele

The slide profiles a regional Bavarian retail chain with 18 branches and 280 employees. It states the 2023 CO₂ baseline at 5,000 tonnes (Scope 1+2) and a 2028 target of 3,000 tonnes, a 40% reduction.

Unternehmensprofil, CO₂-Basislinie & Ziele

  • Regionale Handelskette Bayern: 18 Filialen, 280 Mitarbeiter
  • CO₂-Basislinie 2023: 5.000 t (Scope 1+2)
  • Ziel 2028: 3.000 t CO₂ (−40 % Reduktion)

Source: GreenRetail – Nachhaltigkeitsmaßnahmen-Portfolio CO₂-Reduktion 2025–2028

Slide 2 - Unternehmensprofil, CO₂-Basislinie & Ziele
Slide 3 of 12

Slide 3 - Übersicht: Sechs Maßnahmen (A–F)

The slide overviews six sustainability measures (A–F) for 18 retail branches. They include switching to 100% renewable electricity, LED lighting upgrades, efficient cooling appliances, rooftop solar panels, EV charging stations, and reusable packaging promotion.

Übersicht: Sechs Maßnahmen (A–F)

{ "features": [ { "icon": "⚡", "heading": "A: Ökostrom", "description": "Wechsel zu 100% erneuerbarem Strom in allen 18 Filialen." }, { "icon": "💡", "heading": "B: LED-Beleuchtung", "description": "Austausch aller Lampen auf energieeffiziente LEDs." }, { "icon": "❄️", "heading": "C: Effiziente Kühlmöbel", "description": "Modernisierung von Kühlschränken und -truhen auf Top-Modelle." }, { "icon": "☀️", "heading": "D: PV-Anlagen", "description": "Photovoltaik-Anlagen auf Dächern der Filialen installieren." }, { "icon": "🔌", "heading": "E: Ladesäulen", "description": "E-Ladestationen für Kundenelektrofahrzeuge aufbauen." }, { "icon": "♻️", "heading": "F: Mehrweg-System", "description": "Mehrwegverpackungen für Produkte einführen und fördern." } ] }

Source: GreenRetail – Nachhaltigkeitsmaßnahmen-Portfolio

Speaker Notes
Gesamtpotenzial: bis 2.000 t CO₂/a. Maßnahmen umfassen Energie, Kühlung, Verpackung und Kundenerlebnis.
Slide 3 - Übersicht: Sechs Maßnahmen (A–F)
Slide 4 of 12

Slide 4 - Evaluierungslogik & Kriterien

The slide presents evaluation criteria for measures, weighted by CO₂ reduction (40%), costs (20%), feasibility (20%), visibility (10%), and customer benefit (10%). Each criterion is scored on a 1–10 point scale.

Evaluierungslogik & Kriterien

  • CO₂-Reduktion (40%): Kernziel der Maßnahmen
  • Kosten (20%): Wirtschaftlichkeit priorisieren
  • Umsetzbarkeit (20%): Schnelle Realisierbarkeit
  • Sichtbarkeit (10%): Öffentliche Wirkung
  • Kundennutzen (10%): Kundenbindung stärken
  • Scoring: 1–10 Punkte pro Kriterium
Slide 4 - Evaluierungslogik & Kriterien
Slide 5 of 12

Slide 5 - Kosten-Nutzen- & Scoring-Matrix

The slide features a cost-benefit and scoring matrix for six sustainability measures (A-F), listing costs in €, annual CO₂ reductions in tons, and overall scores. Measure F (Mehrweg) achieves the highest score of 9.5 at 20k € and 300 t/a CO₂ savings, while E (Ladesäulen) scores lowest at 6.5.

Kosten-Nutzen- & Scoring-Matrix

{ "headers": [ "Maßnahme", "Kosten (€)", "CO₂-Red. (t/a)", "Score" ], "rows": [ [ "A: Ökostrom", "50k", "800", "8.5" ], [ "B: LED", "40k", "500", "9.0" ], [ "C: Kühlmöbel", "60k", "600", "7.5" ], [ "D: PV-Anlage", "80k", "700", "8.0" ], [ "E: Ladesäulen", "30k", "200", "6.5" ], [ "F: Mehrweg", "20k", "300", "9.5" ] ] }

Source: GreenRetail Internal Analysis

Speaker Notes
Matrix bewertet Maßnahmen nach Kosten, CO₂-Reduktion (t/a) und Score (1-10). Basis für Priorisierung.
Slide 5 - Kosten-Nutzen- & Scoring-Matrix
Slide 6 of 12

Slide 6 - Priorisierung der Maßnahmen

The slide "Priorisierung der Maßnahmen" ranks LED (B) highest at a priority score of 9.0 and Ökostrom (A) as top priority at 8.5. It allocates €150,000 (60% of the €250,000 total budget) to the top 3 measures.

Priorisierung der Maßnahmen

  • 9,0: LED (B)
  • Höchste Prioritätsscore

  • 8,5: Ökostrom (A)
  • Top Priorität

  • €150.000: Budget Top 3

60% Gesamtbudget (250k €) Source: GreenRetail Portfolio Analyse 2024

Speaker Notes
Heben Sie die Top-Scores (A, B, D) hervor und erklären Sie die Budgetverteilung: 60% für Top-Prioritäten zur Maximierung des CO₂-Impacts.
Slide 6 - Priorisierung der Maßnahmen
Slide 7 of 12

Slide 7 - Szenario A: Max. CO₂-Impact

Scenario A maximizes CO₂ impact by prioritizing high-impact measures like Ökostrom, LED, Kühlmöbel, and PV, targeting key Scope 1+2 energy and cooling emissions. It delivers 2,200 tons annual savings with a €200k budget, offering long-term benefits toward the 2028 -40% reduction goal.

Szenario A: Max. CO₂-Impact

{ "features": [ { "icon": "🎯", "heading": "High-Impact Measures", "description": "Focus on A, B, C, D: Ökostrom, LED, Kühlmöbel, PV." }, { "icon": "📉", "heading": "2,200 t/a Reduction", "description": "Maximum annual CO₂ savings of 2,200 tons." }, { "icon": "💰", "heading": "€200k Budget Fit", "description": "Invests €200,000 for optimal efficiency." }, { "icon": "⏳", "heading": "Long-term Effect", "description": "High CO₂ impact with sustained benefits." }, { "icon": "🏭", "heading": "Energy & Cooling Priority", "description": "Targets key Scope 1+2 emission sources." }, { "icon": "✅", "heading": "Towards -40% Goal", "description": "Strong progress on 2028 CO₂ reduction target." } ] }

Source: GreenRetail – Nachhaltigkeitsmaßnahmen-Portfolio

Slide 7 - Szenario A: Max. CO₂-Impact
Slide 8 of 12

Slide 8 - Szenario B: Schnelle sichtbare Erfolge

Scenario B emphasizes quick visible successes through fast implementation of measures B, E, F within months, with customers immediately noticing charging stations and multi-way options. It delivers low costs of €100,000, a 1,200 t/a CO₂ reduction in Scope 1+2, and boosts customer image, satisfaction, and loyalty.

Szenario B: Schnelle sichtbare Erfolge

{ "features": [ { "icon": "🚀", "heading": "Schnelle Umsetzung", "description": "Maßnahmen B, E, F innerhalb weniger Monate realisierbar." }, { "icon": "👁️", "heading": "Sichtbare Erfolge", "description": "Kunden erkennen Ladesäulen und Mehrweg sofort." }, { "icon": "💰", "heading": "Niedrige Kosten", "description": "Nur 100.000 € für hohe Wirkung und Impact." }, { "icon": "📉", "heading": "1.200 t/a Reduktion", "description": "Signifikante CO₂-Einsparung in Scope 1+2." }, { "icon": "🎯", "heading": "Kundenwirksam", "description": "Steigert Image, Zufriedenheit und Loyalität." } ] }

Source: GreenRetail – Nachhaltigkeitsmaßnahmen-Portfolio CO₂-Reduktion 2025–2028

Speaker Notes
Betone schnelle Umsetzbarkeit, Kundensichtbarkeit und Kosteneffizienz. Fokus: Maßnahmen B (LED), E (Ladesäulen), F (Mehrweg). Reduktion: 1.200 t/a bei 100k €.
Slide 8 - Szenario B: Schnelle sichtbare Erfolge
Slide 9 of 12

Slide 9 - Szenario C: Kundenimpact

Scenario C: Customer Impact features EV charging stations, reusable packaging, and LED lighting to attract eco-conscious shoppers and create an inviting store atmosphere. It delivers 1,000 tons of annual CO₂ savings for just €90,000 investment, while boosting brand image and customer engagement.

Szenario C: Kundenimpact

{ "features": [ { "icon": "⚡", "heading": "Ladesäulen (E)", "description": "EV-Ladestationen ziehen umweltbewusste Kunden an und verbessern das Einkaufserlebnis." }, { "icon": "♻️", "heading": "Mehrweg-System (F)", "description": "Wiederverwendbare Verpackungen fördern Kundenengagement für Nachhaltigkeit und Reduzierung." }, { "icon": "💡", "heading": "LED-Beleuchtung (B)", "description": "Helleres, energieeffizientes Licht schafft einladende und angenehme Ladenatmosphäre." }, { "icon": "📉", "heading": "CO₂-Reduktion", "description": "Insgesamt 1.000 Tonnen CO₂ pro Jahr durch fokussierte Maßnahmen einsparbar." }, { "icon": "💰", "heading": "Kosteneffizient", "description": "Nur 90.000 € Investition für hohen Impact und schnelle Umsetzung." }, { "icon": "⭐", "heading": "Imagewert Steigerung", "description": "Hoher Markenwert durch kundenorientierte, sichtbare Nachhaltigkeitsmaßnahmen erzielt." } ] }

Source: GreenRetail – Nachhaltigkeitsmaßnahmen-Portfolio CO₂-Reduktion 2025–2028

Speaker Notes
Heben Sie den Fokus auf Kundenerlebnis, Imagewert und Kosteneffizienz hervor. Maßnahmen E, F, B.
Slide 9 - Szenario C: Kundenimpact
Slide 10 of 12

Slide 10 - Roadmap 2025–2027 (Szenario A)

The 2025-2027 Roadmap (Scenario A) starts in Q1-Q2 2025 with switching to green electricity and LED lighting across all 18 branches, completing these measures by year-end for Scope 1+2 CO₂ reductions. In 2026, it modernizes refrigeration units and installs rooftop PV systems, culminating in 2027 with full optimizations and monitoring toward a -40% CO₂ target by 2028.

Roadmap 2025–2027 (Szenario A)

2025 Q1-Q2: Ökostrom + LED Einführung Wechsel zu Ökostrom und LED-Beleuchtung in allen 18 Filialen starten für sofortige Einsparungen. 2025 Q3-Q4: 2025 Maßnahmen abschließen Ökostrom-Verträge finalisieren und LED-Installationen vervollständigen für Scope 1+2 Reduktion. 2026 Q1-Q2: Kühlmöbel + PV Umrüstung Kühlaggregate modernisieren und Photovoltaik-Anlagen auf Dächern installieren. 2026 Q3-Q4: 2026 Optimierungen vollenden Kühl- und PV-Systeme in Betrieb nehmen und erste Erträge messen. 2027 Q1-Q4: Gesamtoptimierung und Monitoring Alle Maßnahmen optimieren, CO₂-Fortschritt tracken Richtung -40% Ziel bis 2028.

Source: GreenRetail Nachhaltigkeitsportfolio

Speaker Notes
Fokussiert auf maximale CO₂-Reduktion durch priorisierte Maßnahmen A-F; Meilensteine pro Quartal.
Slide 10 - Roadmap 2025–2027 (Szenario A)
Slide 11 of 12

Slide 11 - Risiken & Abhängigkeiten

The slide outlines key risks including delivery delays for cooling units and PV systems (up to 6 months) and potential funding cuts from political changes, mitigated by planning 3-6 months of buffer time. It also lists dependencies like grid operator approvals for PV and charging stations plus certifications for green electricity and cooling units, mitigated by early applications and exploring alternatives.

Risiken & Abhängigkeiten

RisikenAbhängigkeiten

| • Lieferverzögerungen bei Kühlmöbeln und PV-Anlagen (bis 6 Monate)

  • Förderkürzungen durch politische Änderungen

Mitigation: 3-6 Monate Pufferzeiten einplanen. | • Netzbetreiber-Zulassungen für PV und Ladesäulen

  • Zertifizierungen (Ökostrom, Kühlmöbel)

Mitigation: Frühzeitige Anträge und Alternativen prüfen. |

Source: GreenRetail – Nachhaltigkeitsmaßnahmen-Portfolio CO₂-Reduktion 2025–2028

Speaker Notes
Heben Sie Pufferzeiten als proaktive Maßnahme hervor. Erklären Sie Abhängigkeiten von externen Partnern.
Slide 11 - Risiken & Abhängigkeiten
Slide 12 of 12

Slide 12 - Schluss & Next Steps

The slide concludes that a 40% CO₂ reduction is feasible with Scenario A. Next steps include obtaining approvals in Q1/2025 and starting the kick-off workshop.

Schluss & Next Steps

Machbar: -40% CO₂ mit Szenario A.

Genehmigungen Q1/25 einholen, Kick-off Workshop starten.

Source: GreenRetail – Nachhaltigkeitsmaßnahmen-Portfolio CO₂-Reduktion 2025–2028

Speaker Notes
Zusammenfassen: Szenario A erreicht Ziel machbar. Nächste Schritte klar kommunizieren, Fragen einladen.
Slide 12 - Schluss & Next Steps

Discover More Presentations

Explore thousands of AI-generated presentations for inspiration

Browse Presentations
Powered by AI

Create Your Own Presentation

Generate professional presentations in seconds with Karaf's AI. Customize this presentation or start from scratch.

Create New Presentation

Powered by Karaf.ai — AI-Powered Presentation Generator