Slide 1 of 17
Slide 1 - Mass Wasting Dynamics in the Southern Andes
Mass Wasting Dynamics in the Southern Andes
Temporal and Spatial Changes in Mass Wasting in the Southern Andes (37°S–43°S), Chile
---
Photo by Sven Pieren on Unsplash
Generated from prompt:
Redesign and modernize the uploaded thesis presentation titled 'Cambios temporales y espaciales en remociones en masa en los Andes del Sur (37°S–43°S), Chile'. Create a clean, professional, and visually modern PowerPoint with minimal text, strong visual hierarchy, and consistent color palette (inspired by geology/earth tones + blue accents). Improve slide structure and clarity. Slides: 1. Title slide (modern, minimal, strong typography) 2. Motivation (clean visuals + icons) 3. Problem statement (simplified explanation) 4. Knowledge gap (clear 3-part structure: What exists / What is missing / What we will do) 5. Study area (map-focused slide) 6. Research question & objectives (clean layout) 7. Methodology overview (diagram style) 8. Data & statistical methods (icons + simplified text) 9. SHALSTAB model explanation (visual flow) 10. Results – Soil properties (modern charts placeholders) 11. Results – Statistical findings (clean summary) 12. Results – SHALSTAB (maps & key insights) 13. Discussion (2 slides max, visual bullets) 14. Key implications (highlight insights) 15. Conclusions (strong, concise takeaways) 16. Future work 17. Thank you / Q&A Use short bullet points, modern fonts, lots of whitespace, icons, and clear section transitions. Suggest visuals for each slide.
This presentation analyzes temporal and spatial patterns of mass wasting in the Southern Andes (37°S–43°S), Chile. It covers motivations, research objectives, SHALSTAB modeling, statistical findings, hazard maps, implications for risk mitigation, and
Mass Wasting Dynamics in the Southern Andes
Temporal and Spatial Changes in Mass Wasting in the Southern Andes (37°S–43°S), Chile
---
Photo by Sven Pieren on Unsplash
⛰️ Geological Impact Mass wasting events significantly reshape mountain topography and impact infrastructure in the Southern Andes.
⚠️ Risk Mitigation Understanding spatial and temporal patterns is vital for disaster risk reduction in sensitive ecosystems.
🌍 Changing Environment Climate change and land use shifts are altering the frequency of slope instability.
Generating slide...
Generating slide...
Current Understanding We have static landslide inventories but lack temporal evolution. Existing data models often ignore climate variables.
Our Objective Develop a dynamic model integrating spatial instability (SHALSTAB) with climatic drivers (37°S–43°S).
---
Photo by Hartono Creative Studio on Unsplash
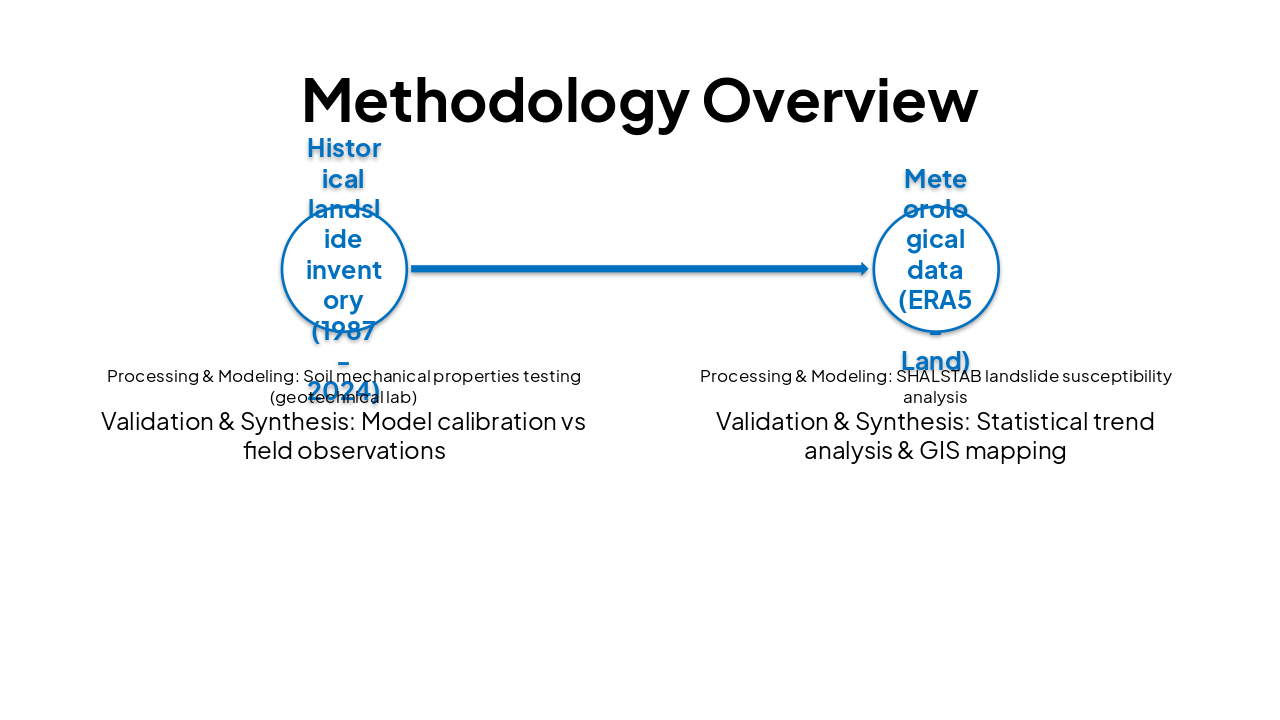
| Data Collection | Processing & Modeling | Validation & Synthesis |
|---|---|---|
| Historical landslide inventory (1987-2024) | Soil mechanical properties testing (geotechnical lab) | Model calibration vs field observations |
| Meteorological data (ERA5-Land) | SHALSTAB landslide susceptibility analysis | Statistical trend analysis & GIS mapping |
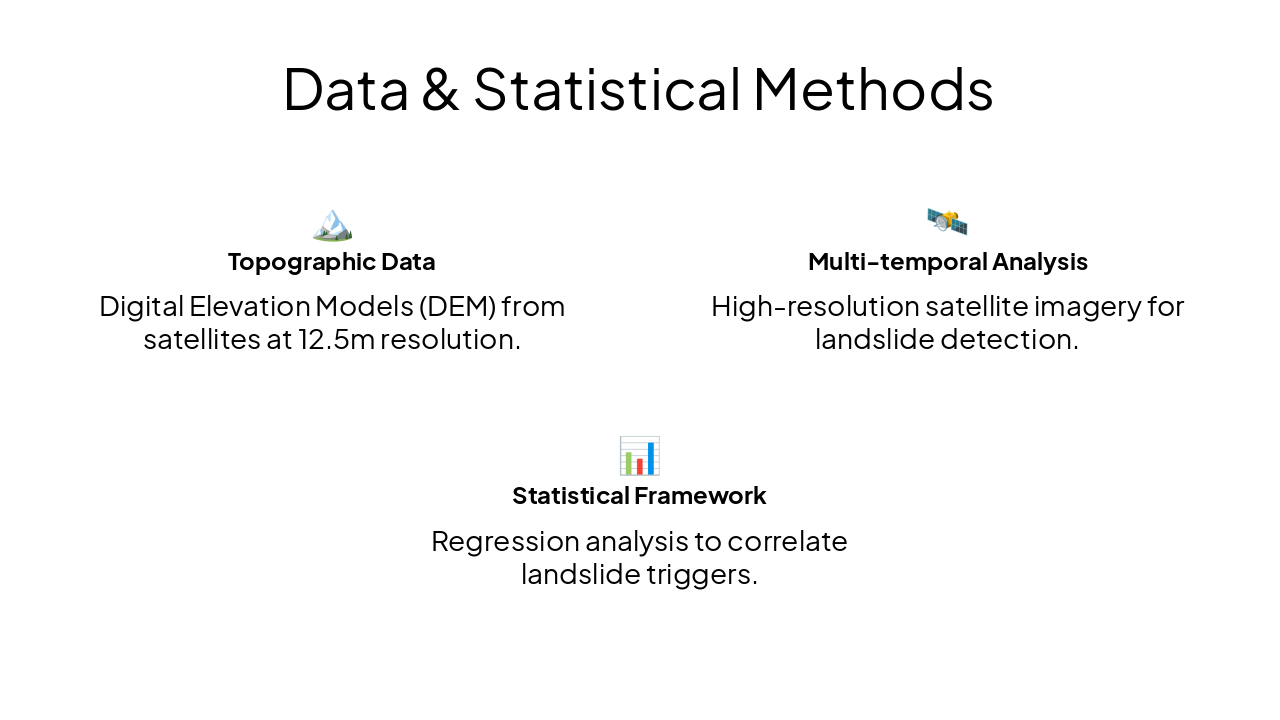
🏔️ Topographic Data Digital Elevation Models (DEM) from satellites at 12.5m resolution.
🛰️ Multi-temporal Analysis High-resolution satellite imagery for landslide detection.
📊 Statistical Framework Regression analysis to correlate landslide triggers.
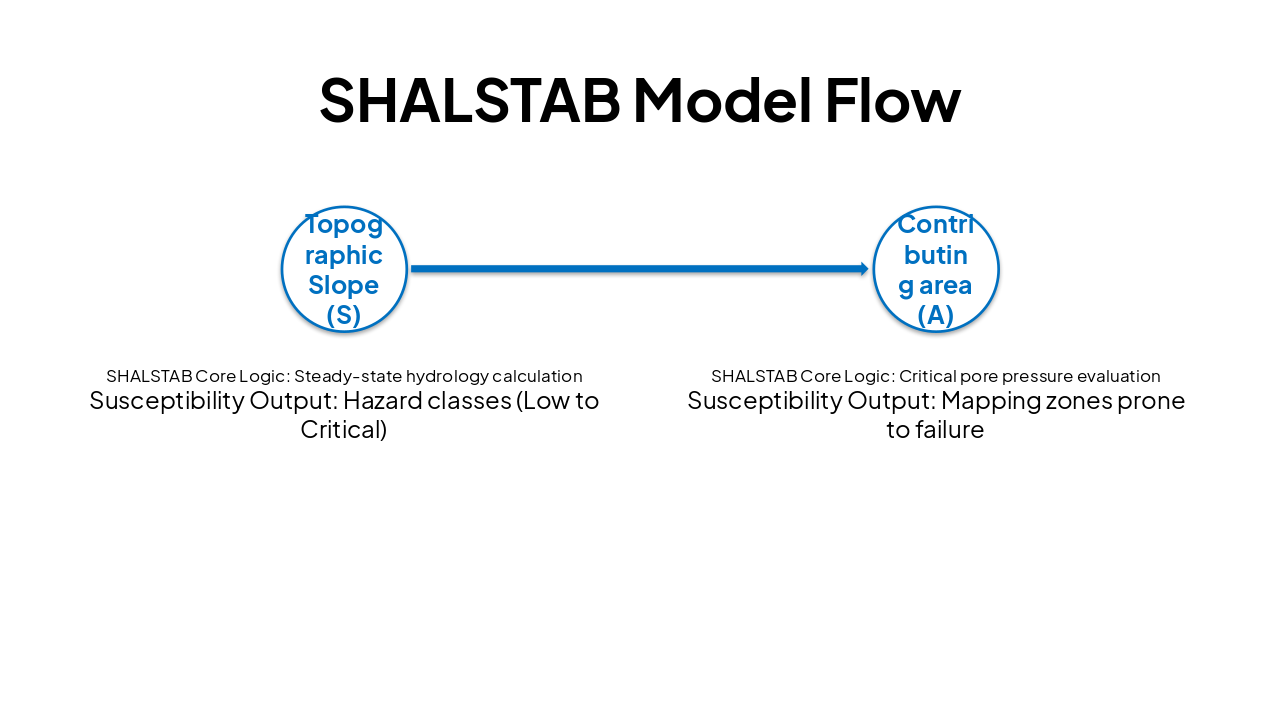
| Input Parameters | SHALSTAB Core Logic | Susceptibility Output |
|---|---|---|
| Topographic Slope (S) | Steady-state hydrology calculation | Hazard classes (Low to Critical) |
| Contributing area (A) | Critical pore pressure evaluation | Mapping zones prone to failure |
---
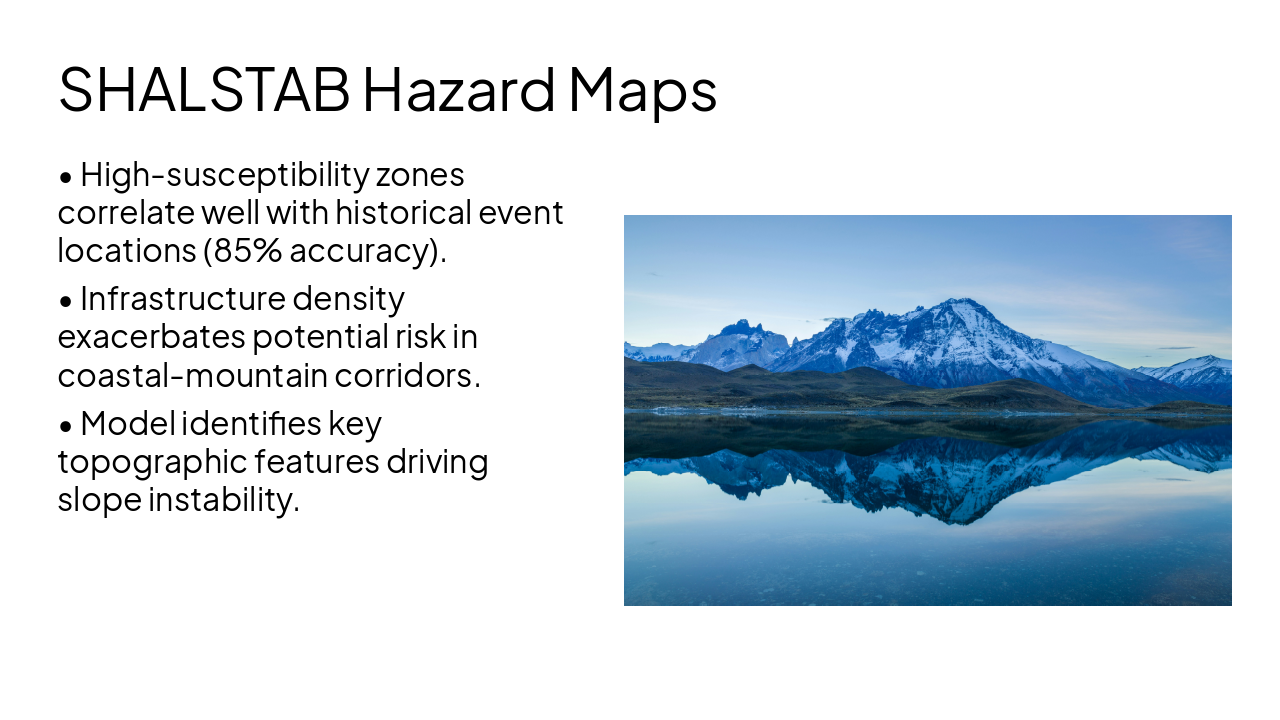
Photo by Chris Stenger on Unsplash
Synthesis & Discussion The SHALSTAB model effectively captures the spatial susceptibility but tends to overestimate risk in dry seasons. Seasonal climate variability is a major, often overlooked factor.
Regional Nuance Vegetation cover significantly buffers soil shear strength, potentially reducing hazard levels in forested sections of the southern range.
Summary: Predicting Landslide Risk for Safer Communities in Chile
The integration of SHALSTAB models with regional meteorological data is essential for accurate risk identification. Future efforts must focus on temporal forecasting to improve disaster resilience in the Southern Andes.
Thank You for Your Time!
Questions & Further Discussion

Explore thousands of AI-generated presentations for inspiration
Generate professional presentations in seconds with Karaf's AI. Customize this presentation or start from scratch.