Slide 1 of 4
Slide 1 - Darktrace PLC: Financial & Strategic Review
Darktrace PLC: Financial & Strategic Review
Financial Performance and Strategic Analysis (FY2022–FY2024)
Generated from prompt:
Polish this presentation i made on the financial analysis of Darktrace over the last 3 years (Slide 1 : SWOT, Slide 2 : Key numbers and Financial Analysis). I want you to make it cleaner, more elegant and subtle, and more Finance / M&A style (less flashy colours, readable text and more structured and aligned)
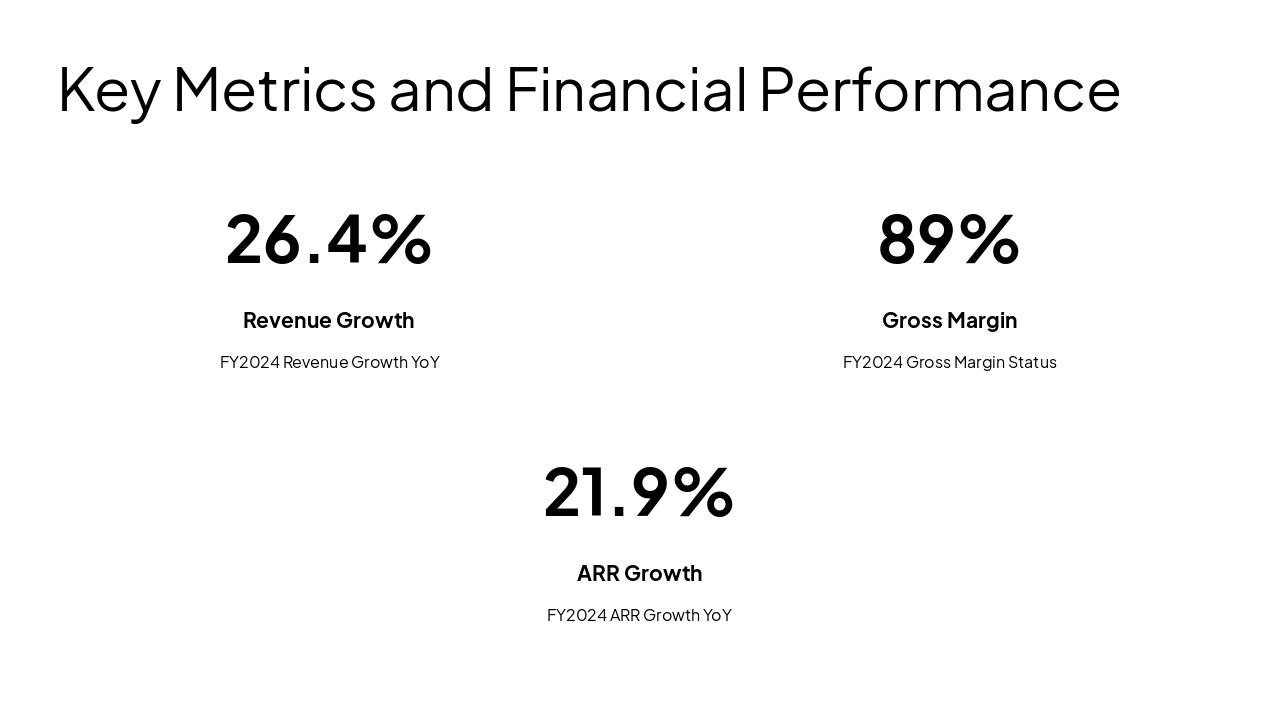
Comprehensive analysis of Darktrace PLC's financial performance (FY2022–FY2024), featuring key metrics, operating trends, and strategic SWOT analysis for informed decision-making.
Darktrace PLC: Financial & Strategic Review
Financial Performance and Strategic Analysis (FY2022–FY2024)
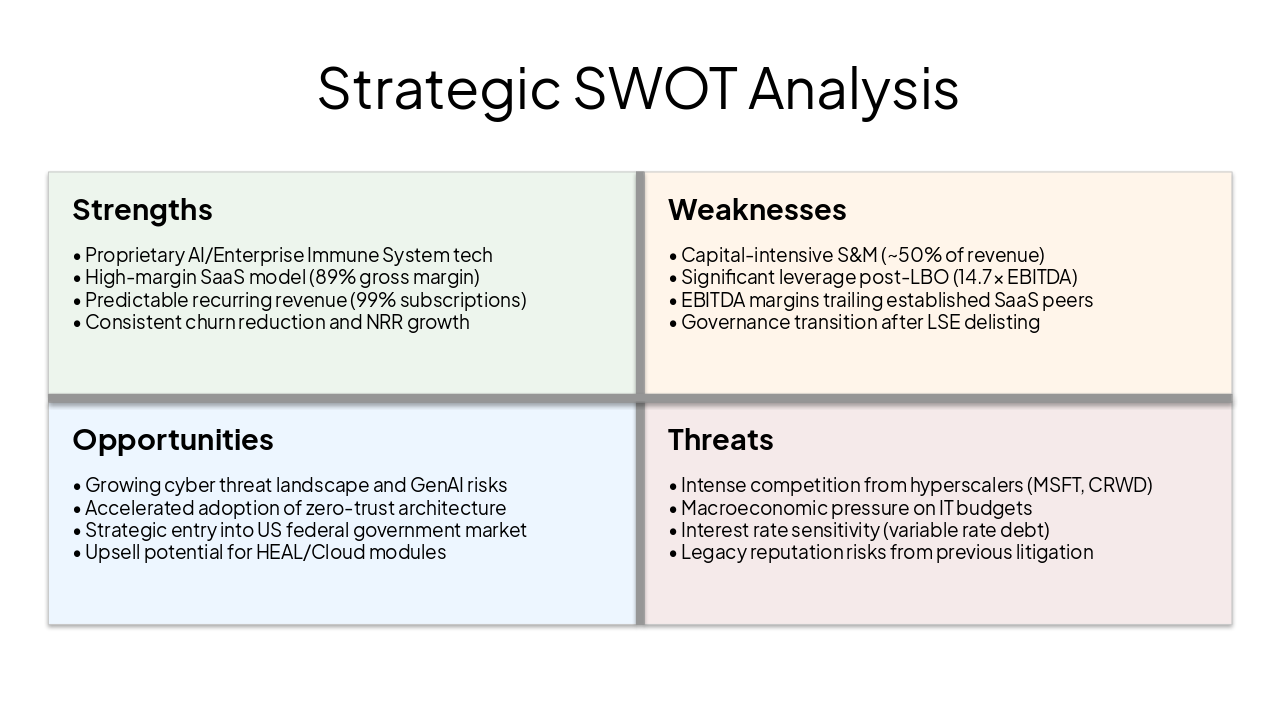
Strengths
Weaknesses
Opportunities
Threats
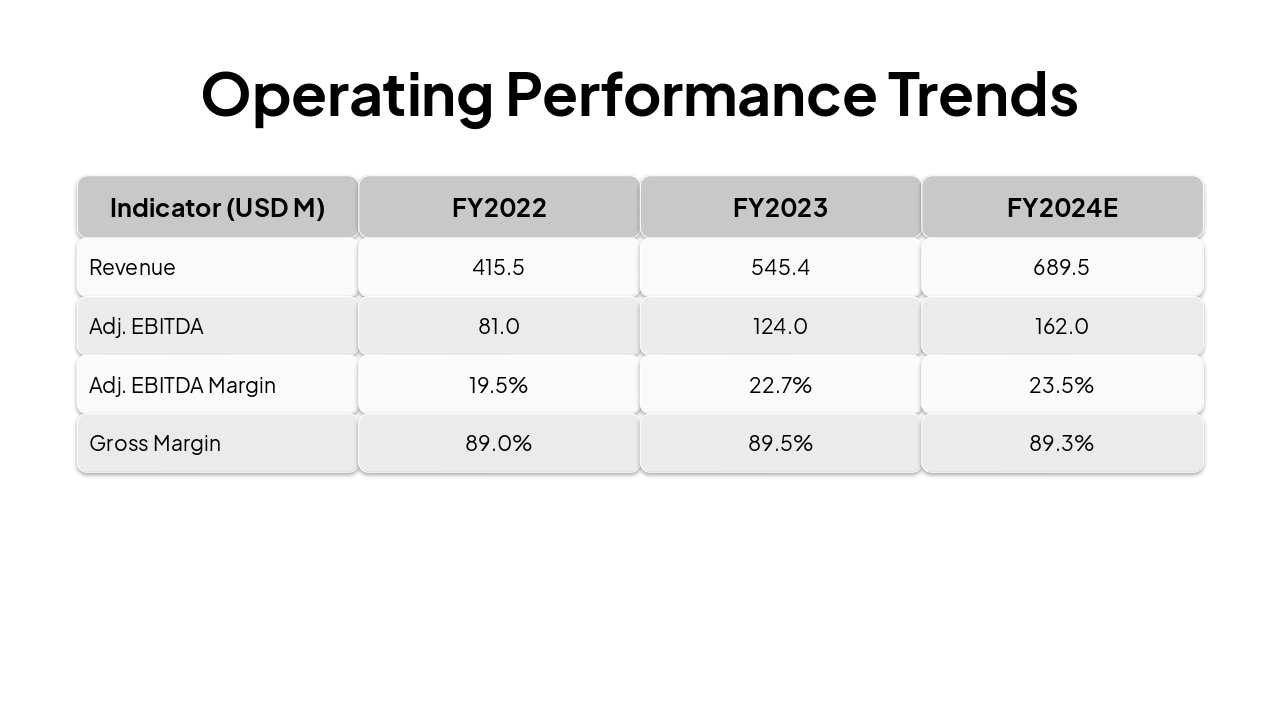
| Indicator (USD M) | FY2022 | FY2023 | FY2024E |
|---|---|---|---|
| Revenue | 415.5 | 545.4 | 689.5 |
| Adj. EBITDA | 81.0 | 124.0 | 162.0 |
| Adj. EBITDA Margin | 19.5% | 22.7% | 23.5% |
| Gross Margin | 89.0% | 89.5% | 89.3% |
Explore thousands of AI-generated presentations for inspiration
Generate professional presentations in seconds with Karaf's AI. Customize this presentation or start from scratch.