Slide 1 of 23
Slide 1 - Rockport 2026 Strategic Mandate
2025 Position 2026 Priorities & Path Forward
Executive Board Presentation
---
Photo by Craig Lovelidge on Unsplash
Generated from prompt:
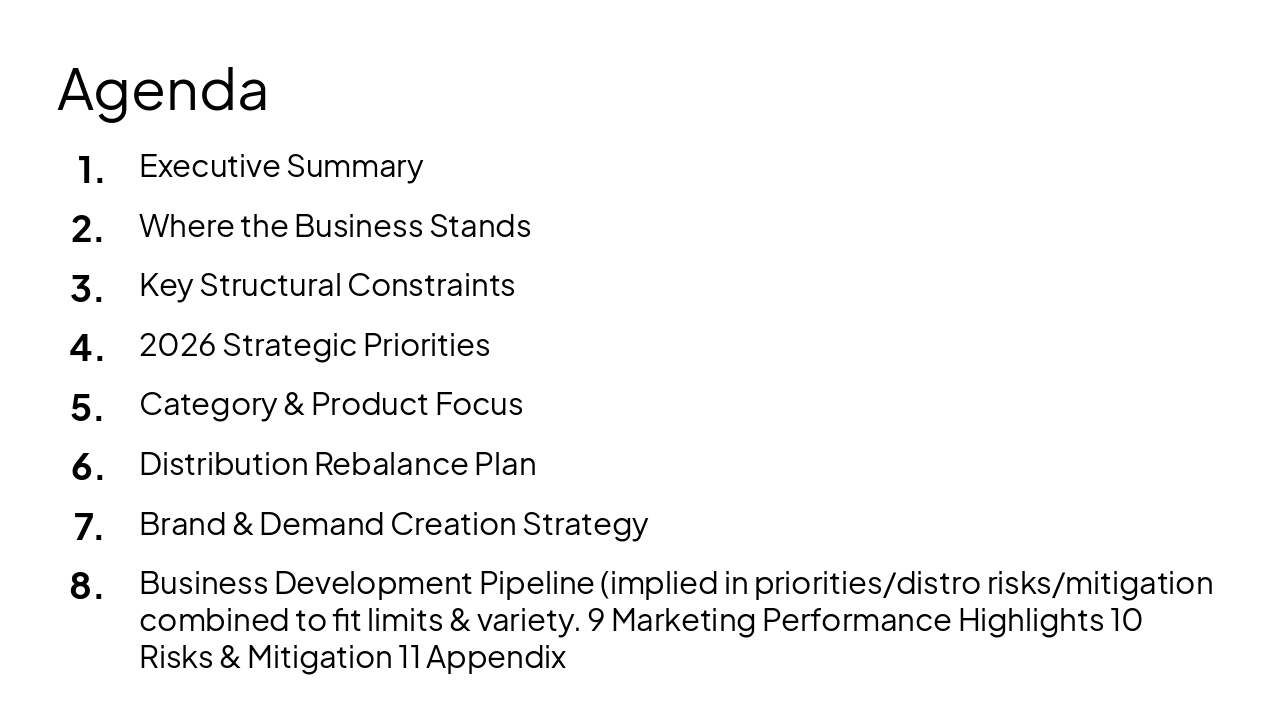
Create an executive-level, brand-aligned presentation based on the uploaded file: /mnt/data/Rockport_JW 02.25.26.pptx. Objectives: - Elevate to board/exec-ready quality (clean, minimal, strategic framing) - Align visuals to Rockport brand (premium, modern, confident, performance heritage) - Tighten messaging: fewer words, clearer headlines, strong takeaways per slide - Add consistent color system (navy/black/white base with restrained accent color), refined typography, more whitespace - Convert dense slides into structured executive story Suggested Structure: 1. Executive Summary (2025 position + 2026 mandate) 2. Where the Business Stands (clean data visualization slides) 3. Key Structural Constraints (Partner concentration, distribution imbalance) 4. 2026 Strategic Priorities (Innovation, Distribution, Brand Campaign) 5. Category & Product Focus (hero product framework) 6. Distribution Rebalance Plan 7. Brand & Demand Creation Strategy 8. Business Development Pipeline 9. Marketing Performance Highlights (2024–2025, cleaned metrics visuals) 10. Risks & Mitigation 11. Appendix (Partner mix + constraints) Design Direction: - Executive minimalism - Strong section divider slides - Charts instead of paragraphs - Remove repetition - Clean product grids - Consistent headline style: Insight-driven, not descriptive Tone: Strategic, decisive, confident. Ensure it feels suitable for CEO / board presentation.
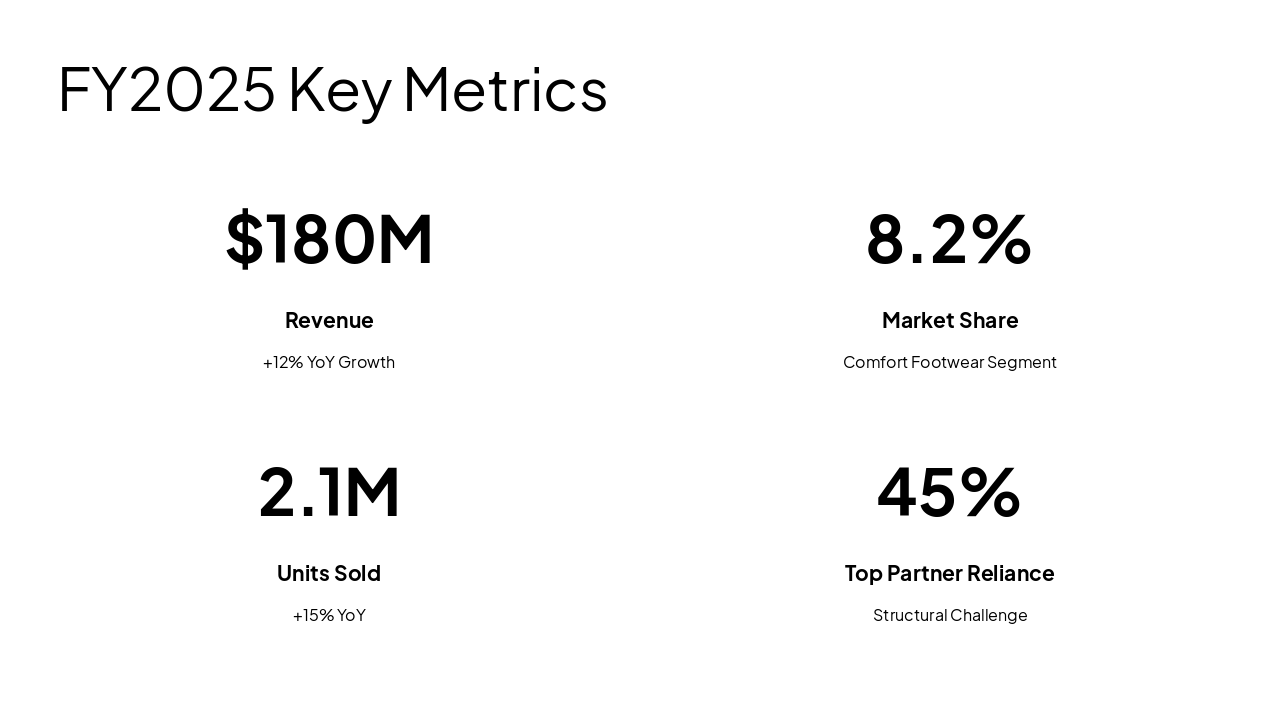
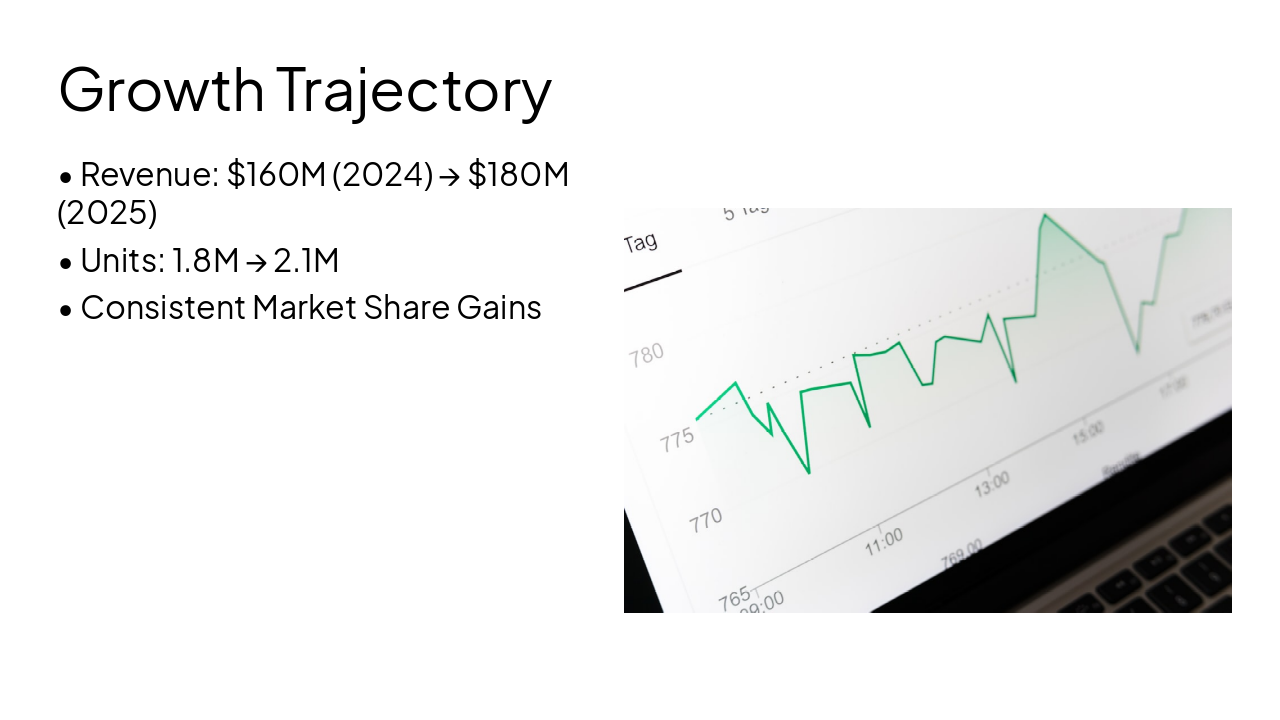
Executive board presentation summarizing Rockport's FY2025 performance (revenue growth to $180M, market share gains), key constraints (45% top partner reliance, distribution imbalance), and 2026 priorities: innovate with hero products, rebalance to 5
2025 Position 2026 Priorities & Path Forward
Executive Board Presentation
---
Photo by Craig Lovelidge on Unsplash
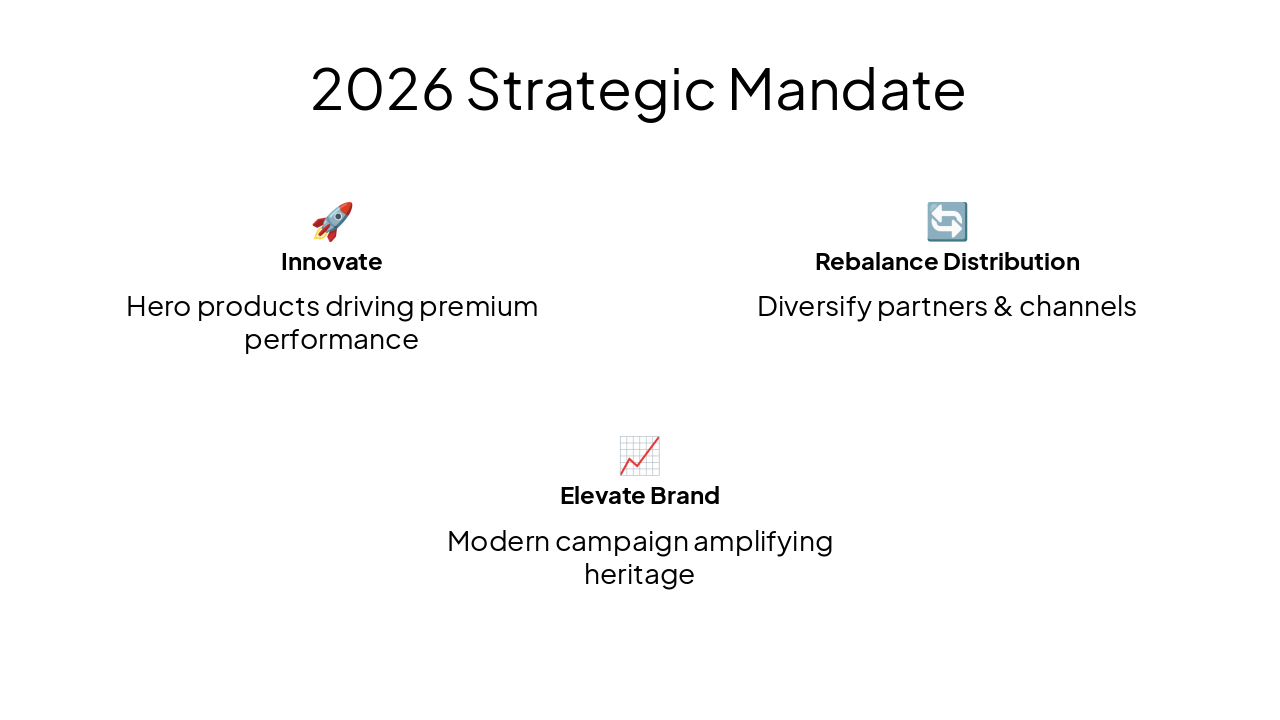
🚀 Innovate Hero products driving premium performance
🔄 Rebalance Distribution Diversify partners & channels
📈 Elevate Brand Modern campaign amplifying heritage
2
Clean Data Visualization
---
Photo by Markus Winkler on Unsplash
3
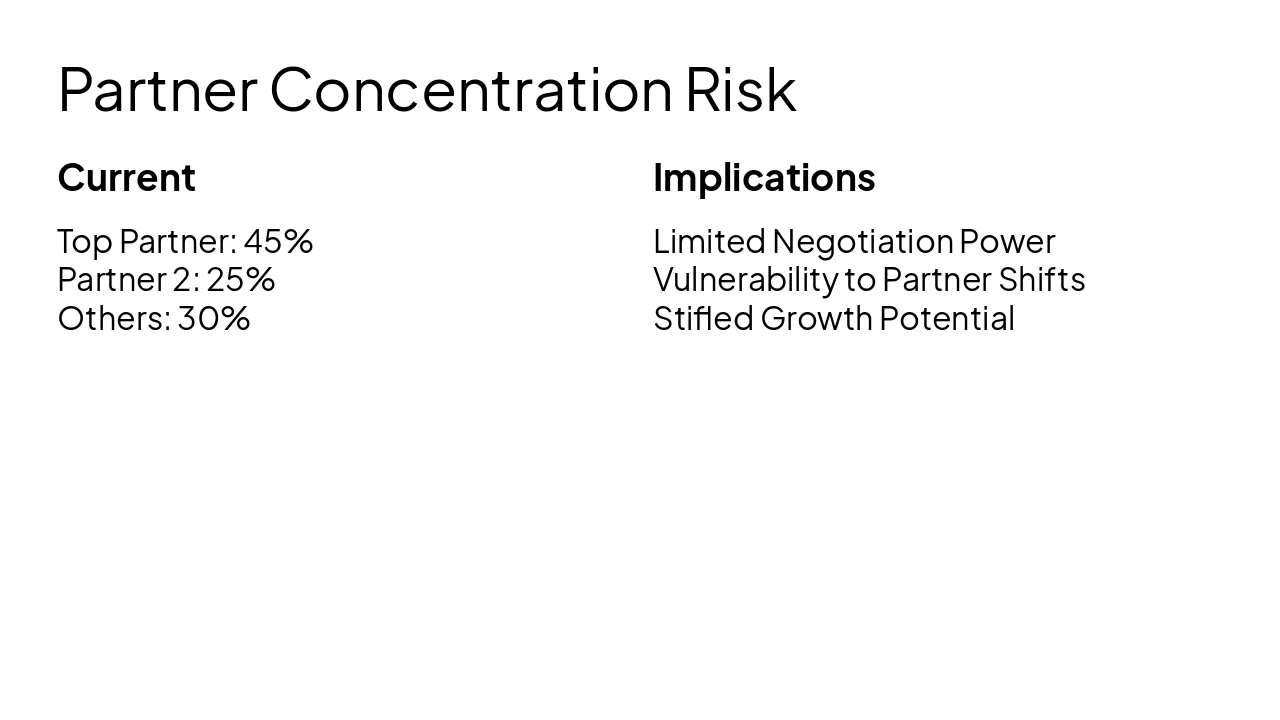
Partner Concentration & Distribution Imbalance
Current Top Partner: 45% Partner 2: 25% Others: 30%
Implications Limited Negotiation Power Vulnerability to Partner Shifts Stifled Growth Potential
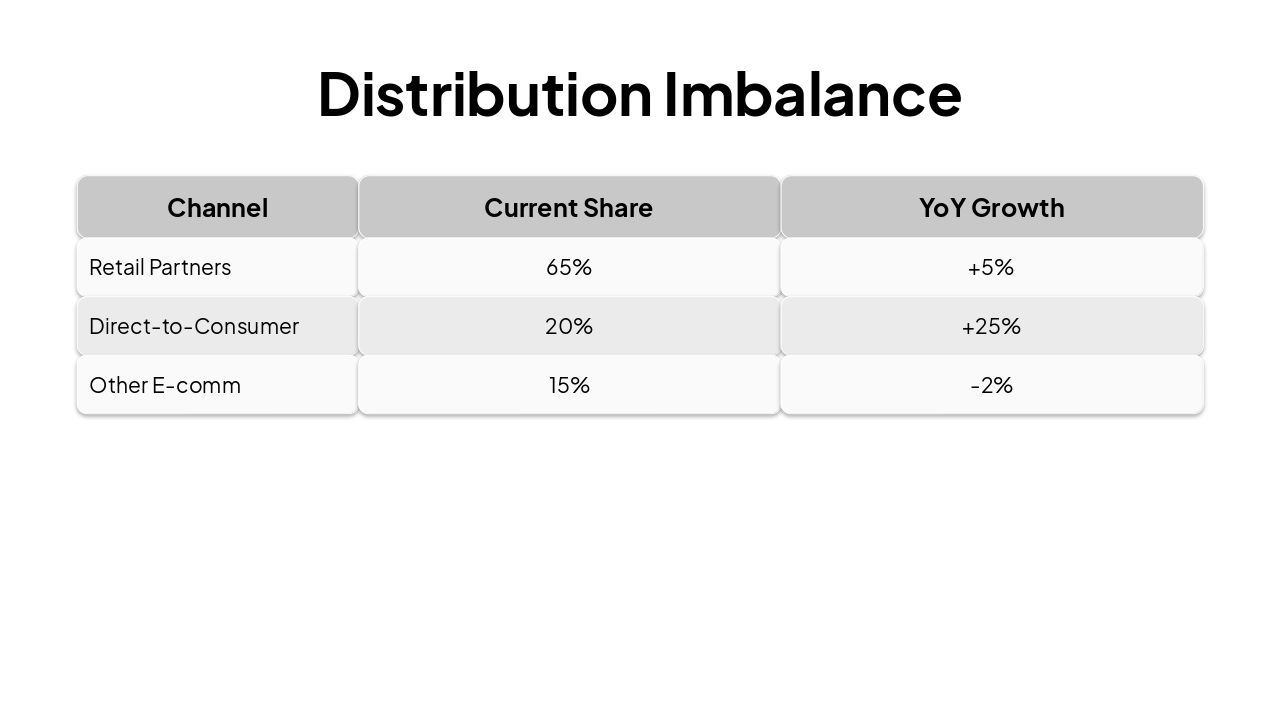
| Channel | Current Share | YoY Growth |
|---|---|---|
| Retail Partners | 65% | +5% |
| Direct-to-Consumer | 20% | +25% |
| Other E-comm | 15% | -2% |
4
Innovation, Distribution, Brand Campaign
---
Photo by Noah Smith on Unsplash
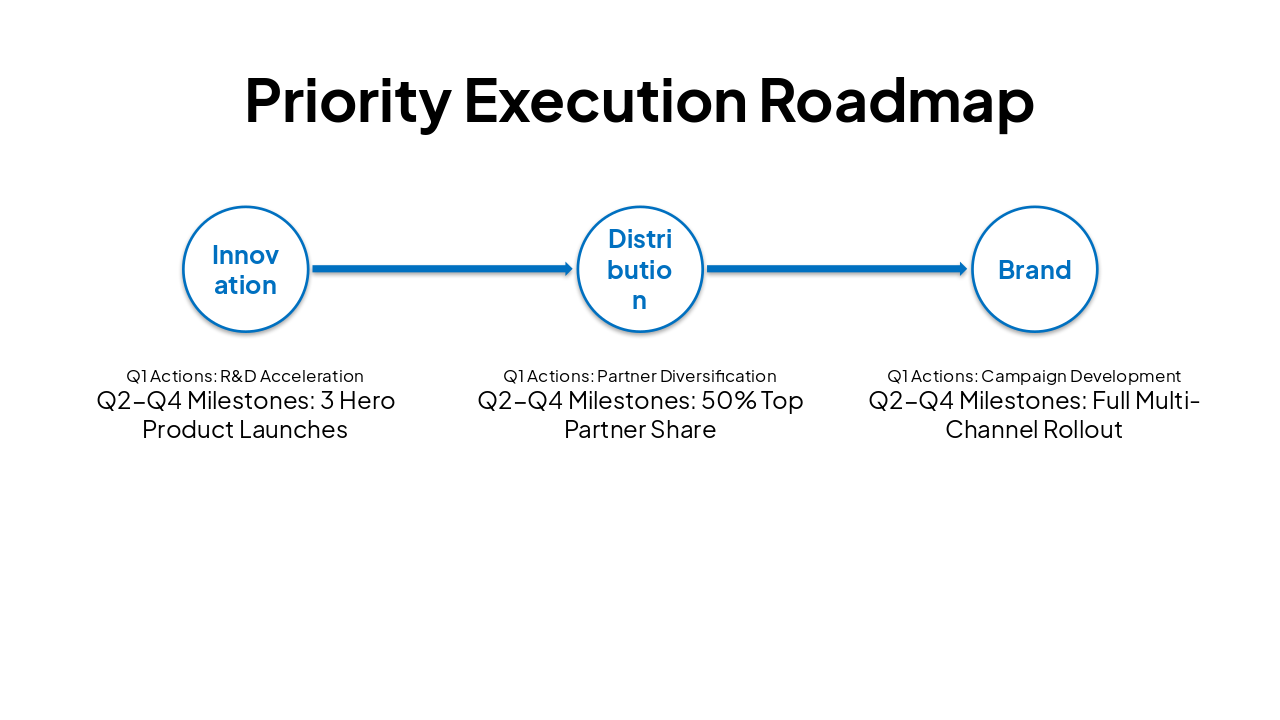
| Priority | Q1 Actions | Q2-Q4 Milestones |
|---|---|---|
| Innovation | R&D Acceleration | 3 Hero Product Launches |
| Distribution | Partner Diversification | 50% Top Partner Share |
| Brand | Campaign Development | Full Multi-Channel Rollout |
5
Hero Product Framework in $200B Industry
---
Photo by Pat Kwon on Unsplash
---
Photo by Jakub Żerdzicki on Unsplash
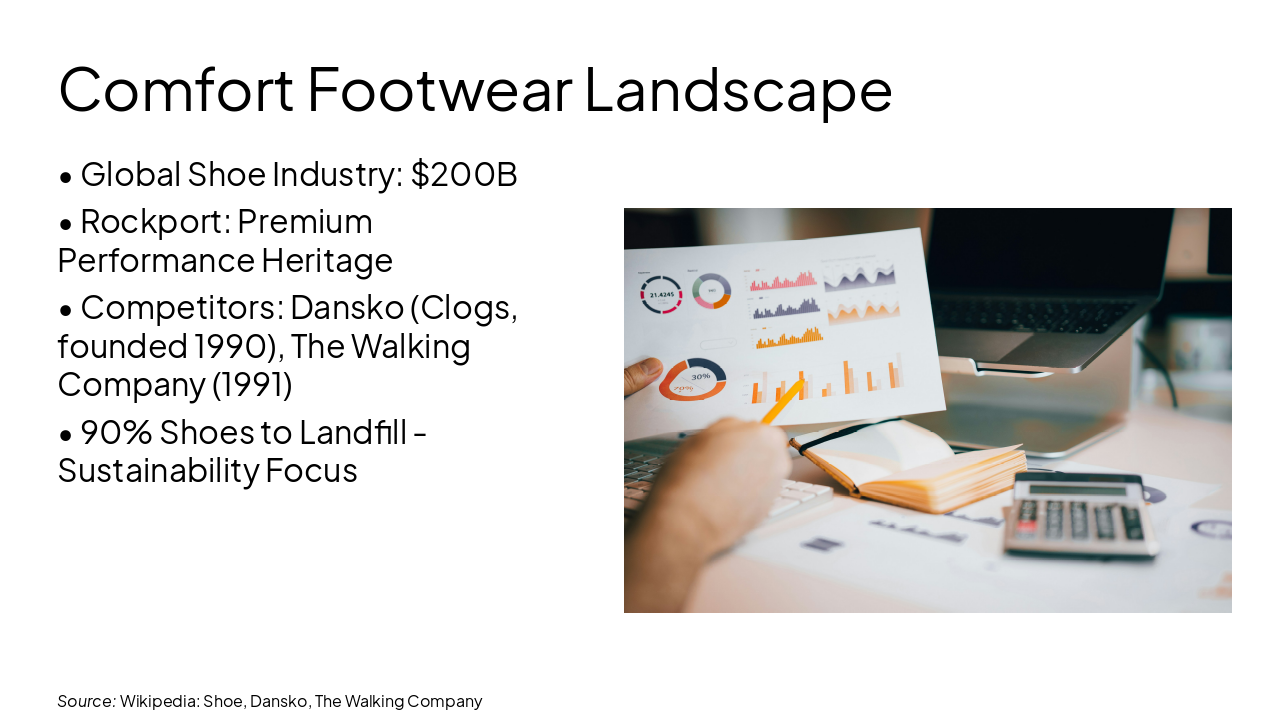
Source: Wikipedia: Shoe, Dansko, The Walking Company
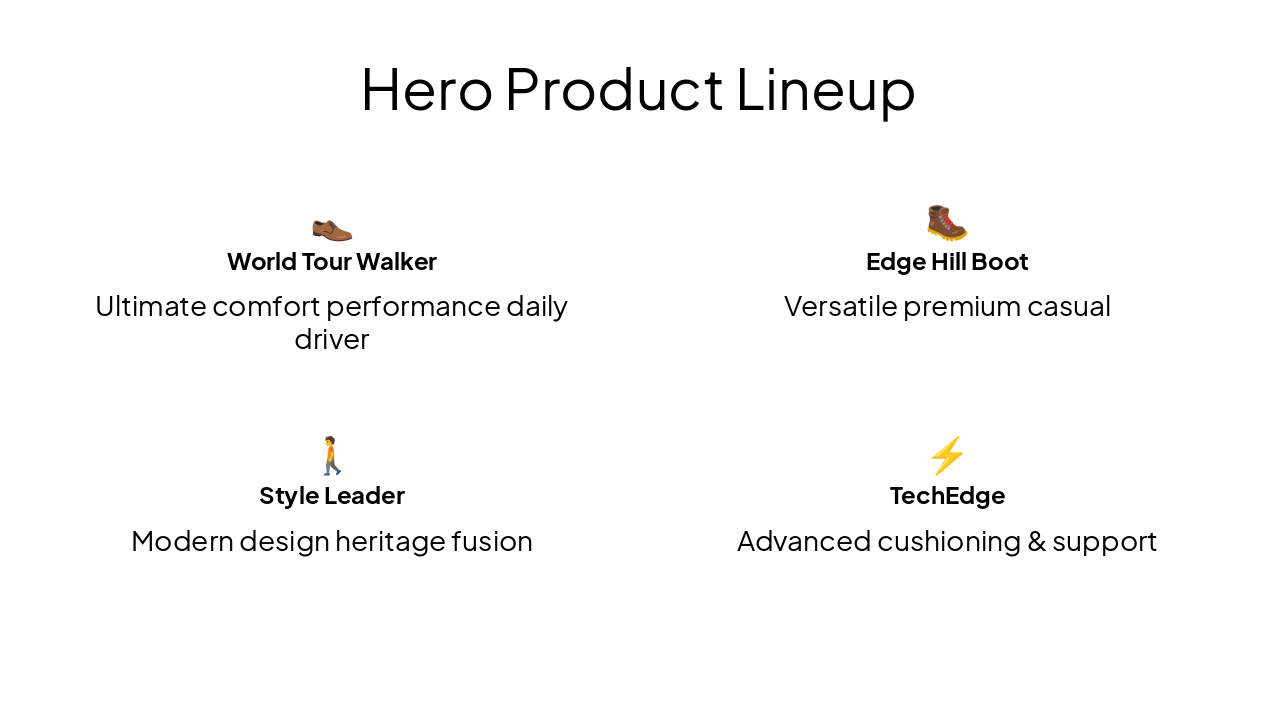
👞 World Tour Walker Ultimate comfort performance daily driver
🥾 Edge Hill Boot Versatile premium casual
🚶 Style Leader Modern design heritage fusion
⚡ TechEdge Advanced cushioning & support
6
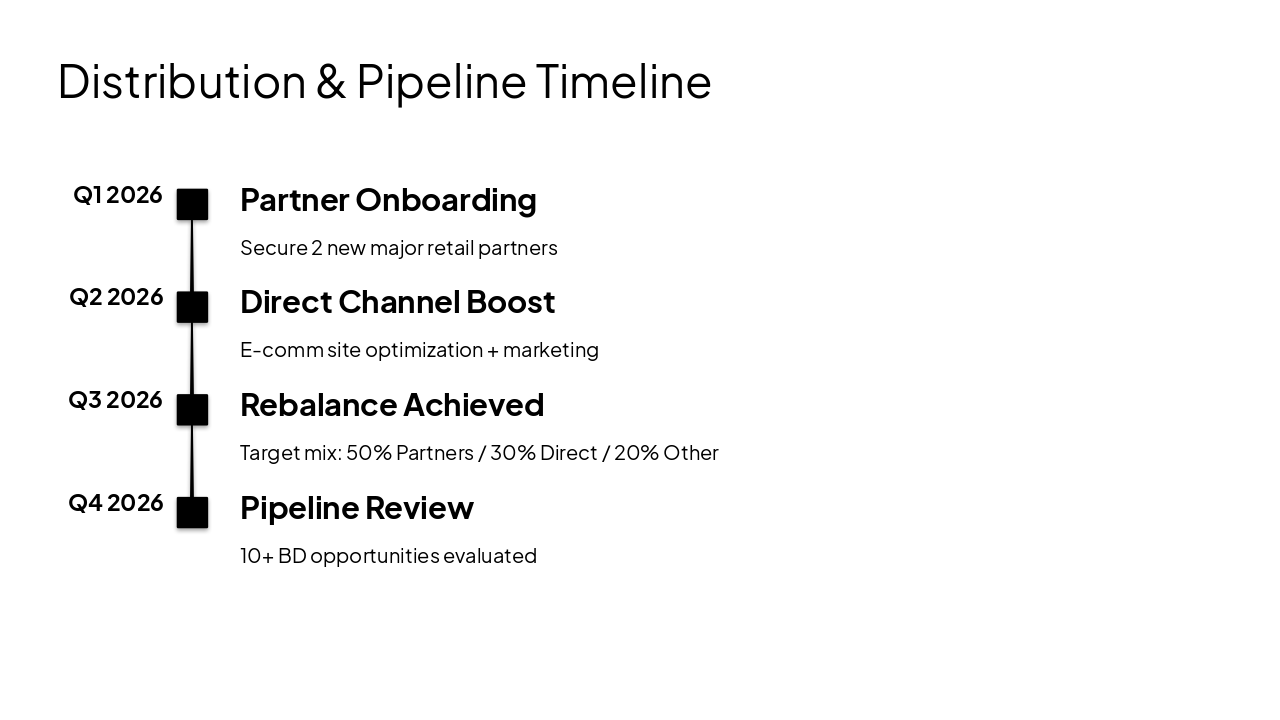
From 65/20/15 to 50/30/20
---
Photo by Jack Stapleton on Unsplash
Q1 2026: Partner Onboarding Secure 2 new major retail partners Q2 2026: Direct Channel Boost E-comm site optimization + marketing Q3 2026: Rebalance Achieved Target mix: 50% Partners / 30% Direct / 20% Other Q4 2026: Pipeline Review 10+ BD opportunities evaluated
7
Premium Modern Confident Performance Heritage
> Shoes provide protection and comfort, evolving into fashion and performance icons. Rockport leads premium comfort.
— Adapted from Shoe Industry Heritage (Wikipedia)
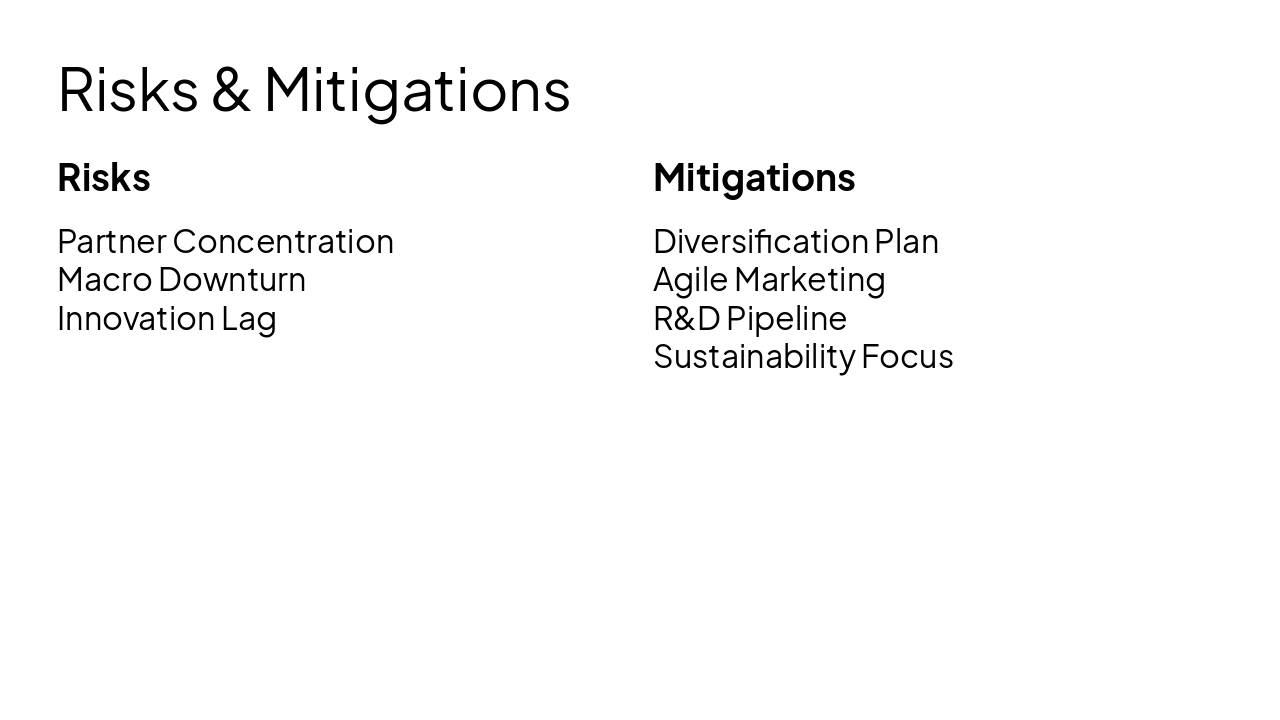
Risks Partner Concentration Macro Downturn Innovation Lag
Mitigations Diversification Plan Agile Marketing R&D Pipeline Sustainability Focus
Execute the 2026 Mandate: Innovate | Rebalance | Elevate
Q&A | Next Steps
---
Photo by Vitaly Gariev on Unsplash
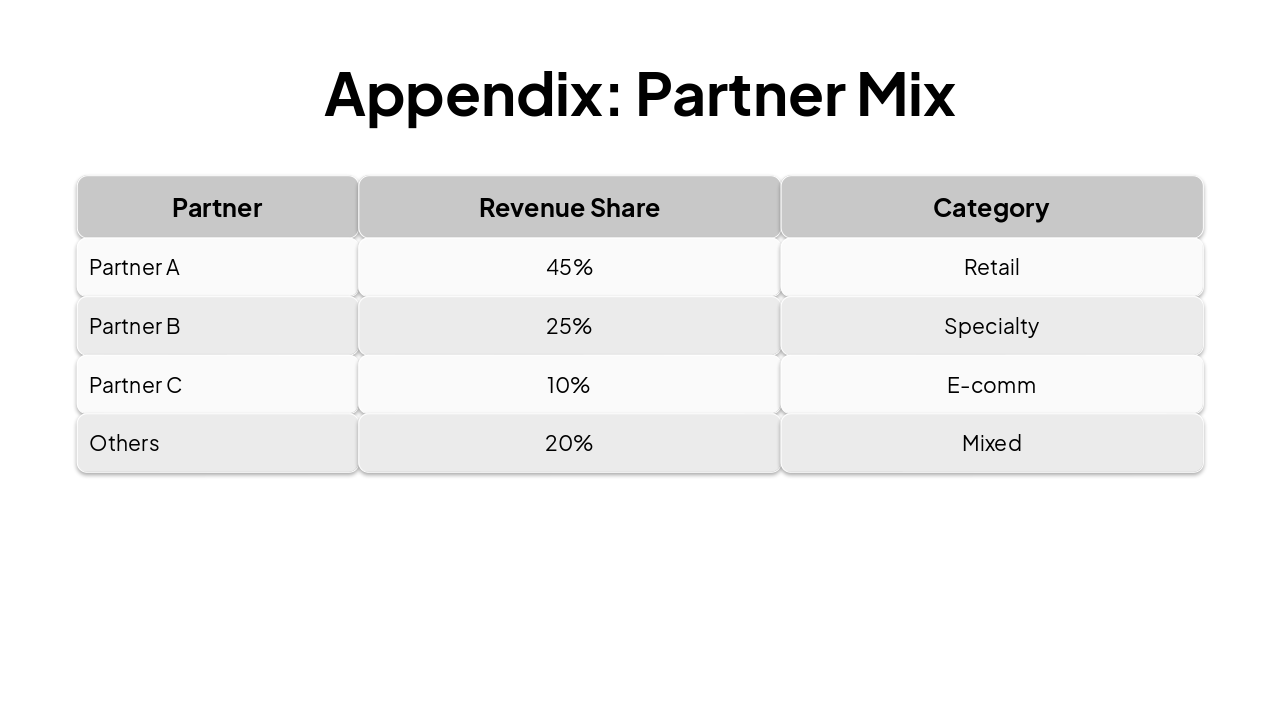
| Partner | Revenue Share | Category |
|---|---|---|
| Partner A | 45% | Retail |
| Partner B | 25% | Specialty |
| Partner C | 10% | E-comm |
| Others | 20% | Mixed |
Explore thousands of AI-generated presentations for inspiration
Generate professional presentations in seconds with Karaf's AI. Customize this presentation or start from scratch.