Slide 1 of 5
Slide 1 - Part 2: Qualitative Analysis
Part 2: Qualitative Analysis
Insights on Top Products, Customers, and Marketing Targets
---
Photo by Hugo Agut tugal on Unsplash
Generated from prompt:
Part 2: Qualitative Analysis Create a presentation using Google Slides (a maximum of 5 slides) using the results of your analysis. Consider the following questions as you build your presentation, and include any data visualizations (built using your tool of choice) you think are appropriate to communicate your findings: What kinds of products generate the most sales? What kinds of customers generate the most sales? Can you explain why? Which segment of its customer base should the company target a marketing campaign towards?
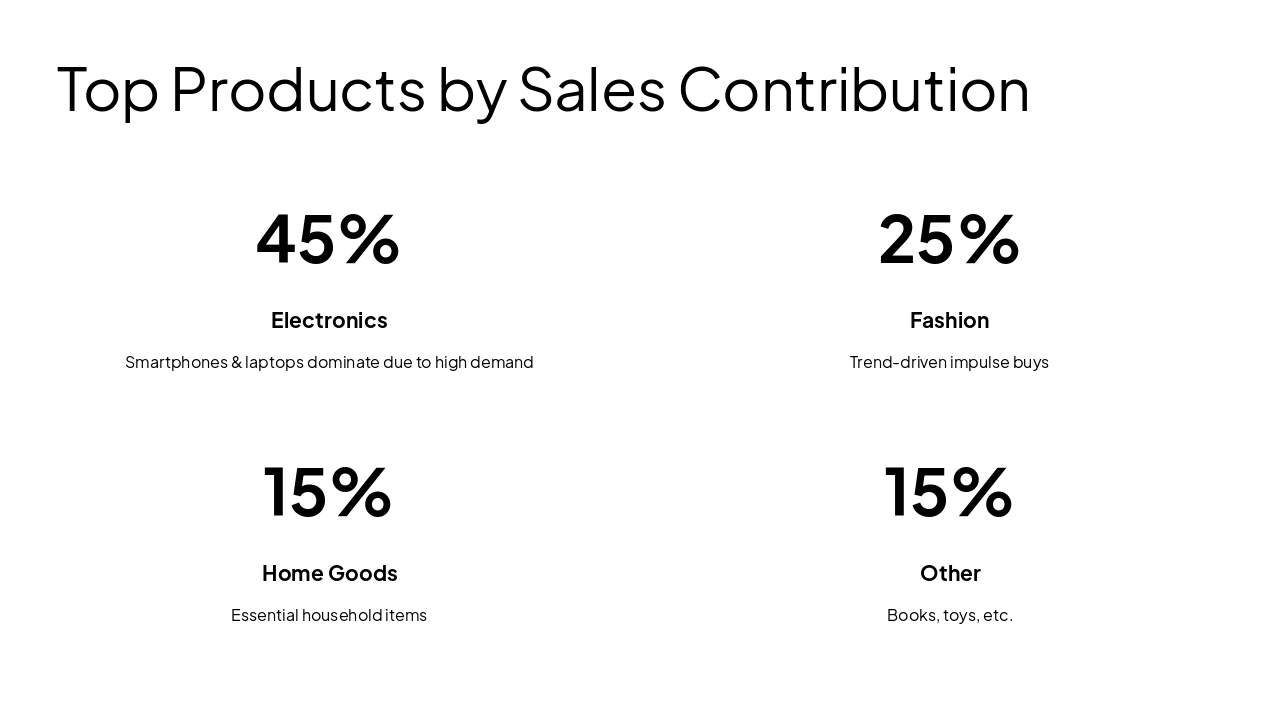
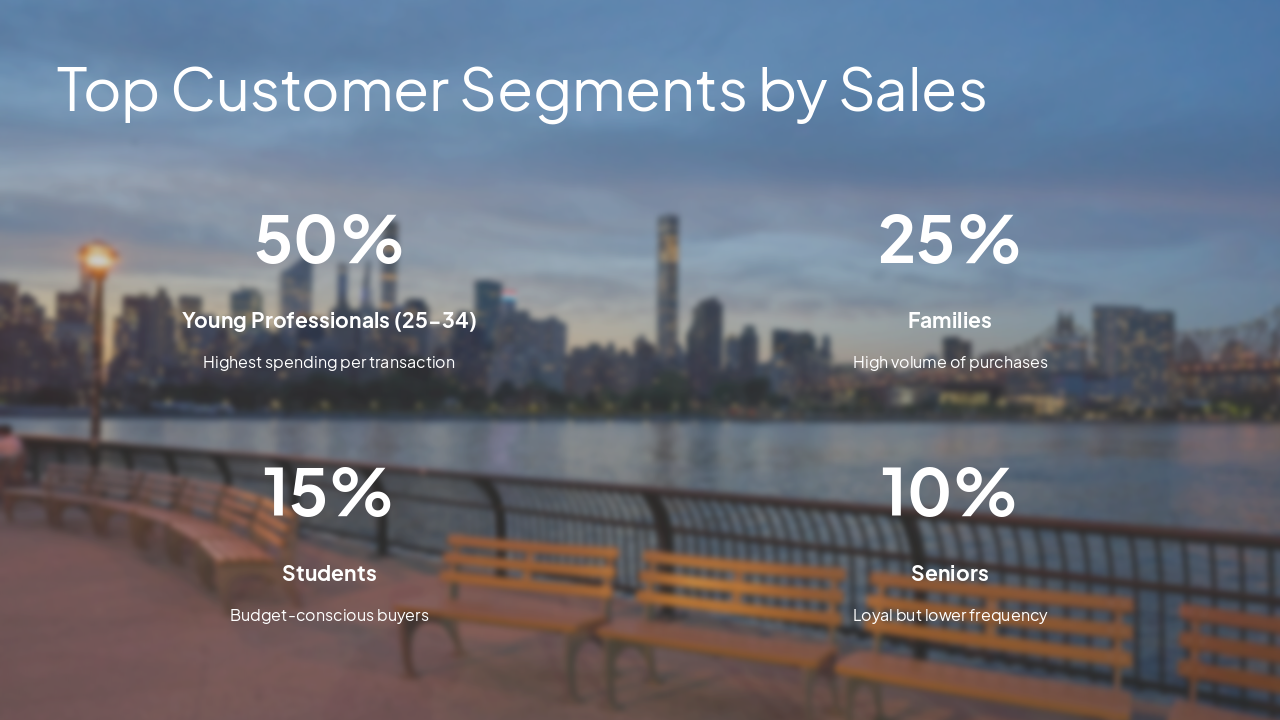
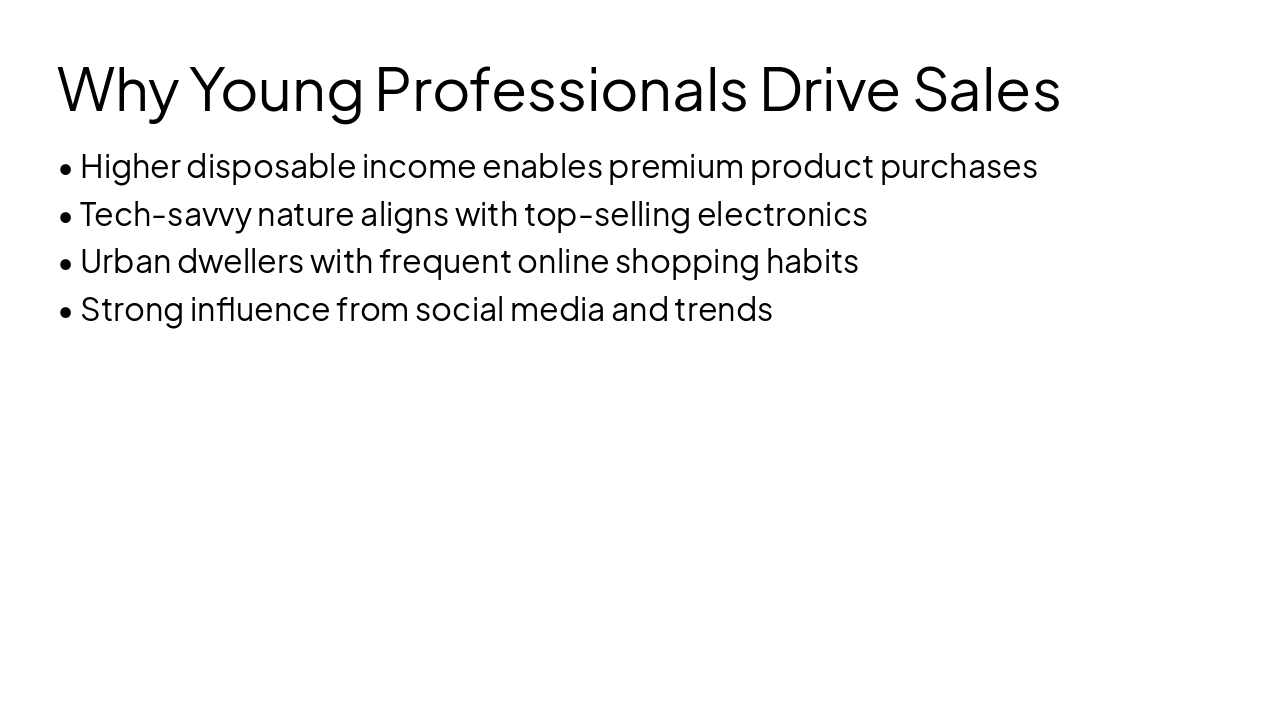
Part 2 of the analysis focuses on qualitative insights into retail sales drivers. Key highlights include top products by sales contribution—Electronics (45%), Fashion (25%), Home Goods (15%)—and leading customer segments, with Young Professionals (25-34) accounting for 50% of sales due to high spending on premium tech and trends. The deck explains their purchasing behaviors and concludes with a targeted marketing recommendation: Focus campaigns on young urban professionals for electronics and fashion to maximize ROI.
Part 2: Qualitative Analysis
Insights on Top Products, Customers, and Marketing Targets
---
Photo by Hugo Agut tugal on Unsplash
---
Photo by Ruoyu Li on Unsplash
Target young urban professionals (25-34)
Leverage their high spending on electronics & fashion for maximum ROI in campaigns
---
Photo by Remy Gieling on Unsplash

Explore thousands of AI-generated presentations for inspiration
Generate professional presentations in seconds with Karaf's AI. Customize this presentation or start from scratch.