The World of Statistics: Exploring Data Collection, Analysis, and Interpretation

Generated from prompt:

Statistics

This presentation provides a comprehensive overview of statistics, covering its definition, core methods like descriptive and inferential statistics, challenges such as errors and bias, and its diverse applications across various fields. It emphasizes the discipline's importance in understanding and interpreting the world through data.

May 16, 202615 slides
Slide 1 of 15

Slide 1 - The World of Statistics

The World of Statistics

Exploring the Discipline of Data Collection, Analysis, and Interpretation

---

Photo by Conny Schneider on Unsplash

Slide 1 - The World of Statistics
Slide 2 of 15

Slide 2 - Presentation Agenda

  • Introduction to Statistics
  • Key Statistical Methods
  • Understanding Errors and Bias
  • Applications of Statistics
  • Conclusion

---

Photo by Roman Bozhko on Unsplash

Slide 2 - Presentation Agenda
Slide 3 of 15

Slide 3 - Introduction to Statistics

1

Introduction

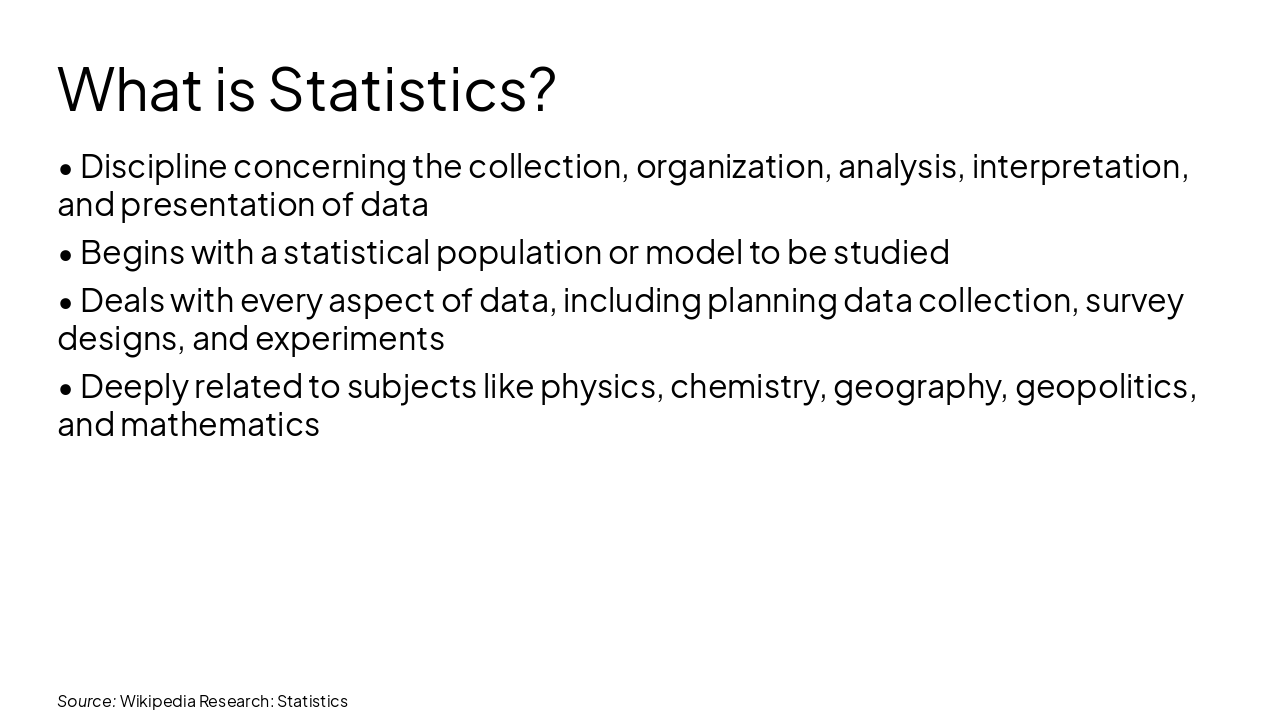
Defining the Discipline

---

Photo by Dom Fou on Unsplash

Slide 3 - Introduction to Statistics
Slide 4 of 15

Slide 4 - What is Statistics?

  • Discipline concerning the collection, organization, analysis, interpretation, and presentation of data
  • Begins with a statistical population or model to be studied
  • Deals with every aspect of data, including planning data collection, survey designs, and experiments
  • Deeply related to subjects like physics, chemistry, geography, geopolitics, and mathematics

Source: Wikipedia Research: Statistics

Slide 4 - What is Statistics?
Slide 5 of 15

Slide 5 - Collecting & Studying Data

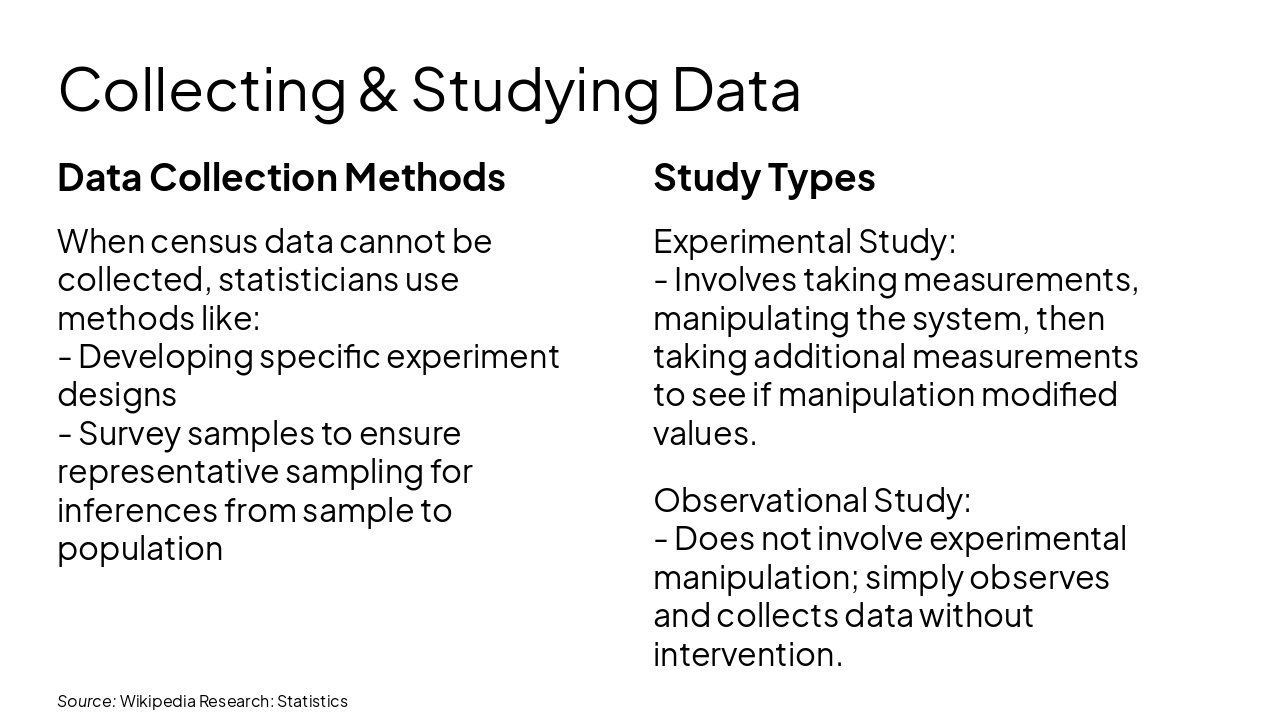
Data Collection Methods When census data cannot be collected, statisticians use methods like:

  • Developing specific experiment designs
  • Survey samples to ensure representative sampling for inferences from sample to population

Study Types Experimental Study:

  • Involves taking measurements, manipulating the system, then taking additional measurements to see if manipulation modified values.

Observational Study:

  • Does not involve experimental manipulation; simply observes and collects data without intervention.

Source: Wikipedia Research: Statistics

Slide 5 - Collecting & Studying Data
Slide 6 of 15

Slide 6 - Statistical Methods

2

Key Methods

Descriptive vs. Inferential Statistics

---

Photo by Andrey Novik on Unsplash

Slide 6 - Statistical Methods
Slide 7 of 15

Slide 7 - Descriptive vs. Inferential Statistics

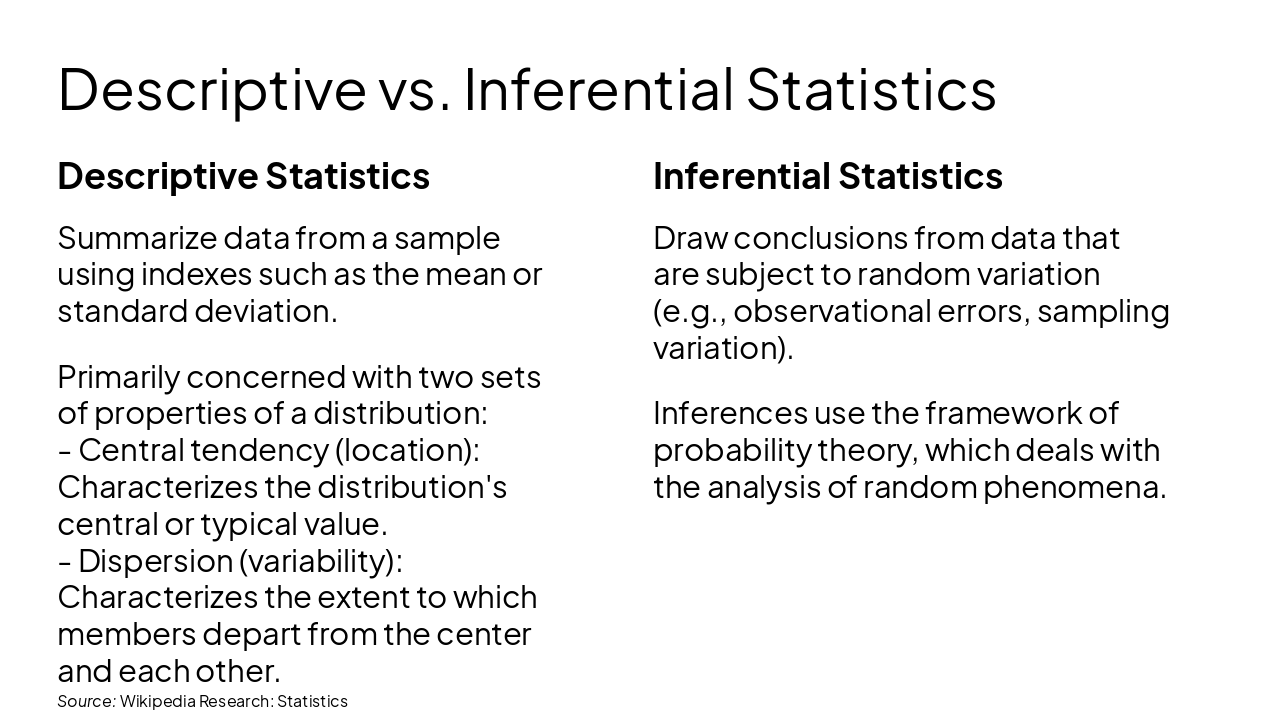
Descriptive Statistics Summarize data from a sample using indexes such as the mean or standard deviation.

Primarily concerned with two sets of properties of a distribution:

  • Central tendency (location): Characterizes the distribution's central or typical value.
  • Dispersion (variability): Characterizes the extent to which members depart from the center and each other.

Inferential Statistics Draw conclusions from data that are subject to random variation (e.g., observational errors, sampling variation).

Inferences use the framework of probability theory, which deals with the analysis of random phenomena.

Source: Wikipedia Research: Statistics

Slide 7 - Descriptive vs. Inferential Statistics
Slide 8 of 15

Slide 8 - Hypothesis Testing and Errors

  • Involves collecting data to test the relationship between two statistical data sets, or a data set and synthetic data from an idealized model.
  • A hypothesis is proposed for the statistical relationship, an alternative to an idealized null hypothesis (no relationship).
  • Rejecting or disproving the null hypothesis is done using statistical tests.
  • Two basic forms of error are recognized:
  • - Type I errors: Null hypothesis is rejected when it is true (false positive).
  • - Type II errors: Null hypothesis fails to be rejected when it is false (false negative).

Source: Wikipedia Research: Statistics

Slide 8 - Hypothesis Testing and Errors
Slide 9 of 15

Slide 9 - Understanding Errors & Bias

3

Errors and Bias

Challenges in Statistical Measurement

---

Photo by Deng Xiang on Unsplash

Slide 9 - Understanding Errors & Bias
Slide 10 of 15

Slide 10 - Sources of Error

  • Statistical measurement processes are prone to error regarding the data they generate.
  • Many errors are classified as random (noise) or systematic (bias).
  • Other types of errors, such as blunders (e.g., reporting incorrect units), can also occur.
  • The presence of missing data or censoring may result in biased estimates, and specific techniques address these problems.

Source: Wikipedia Research: Statistics

Slide 10 - Sources of Error
Slide 11 of 15

Slide 11 - Applications of Statistics

4

Applications

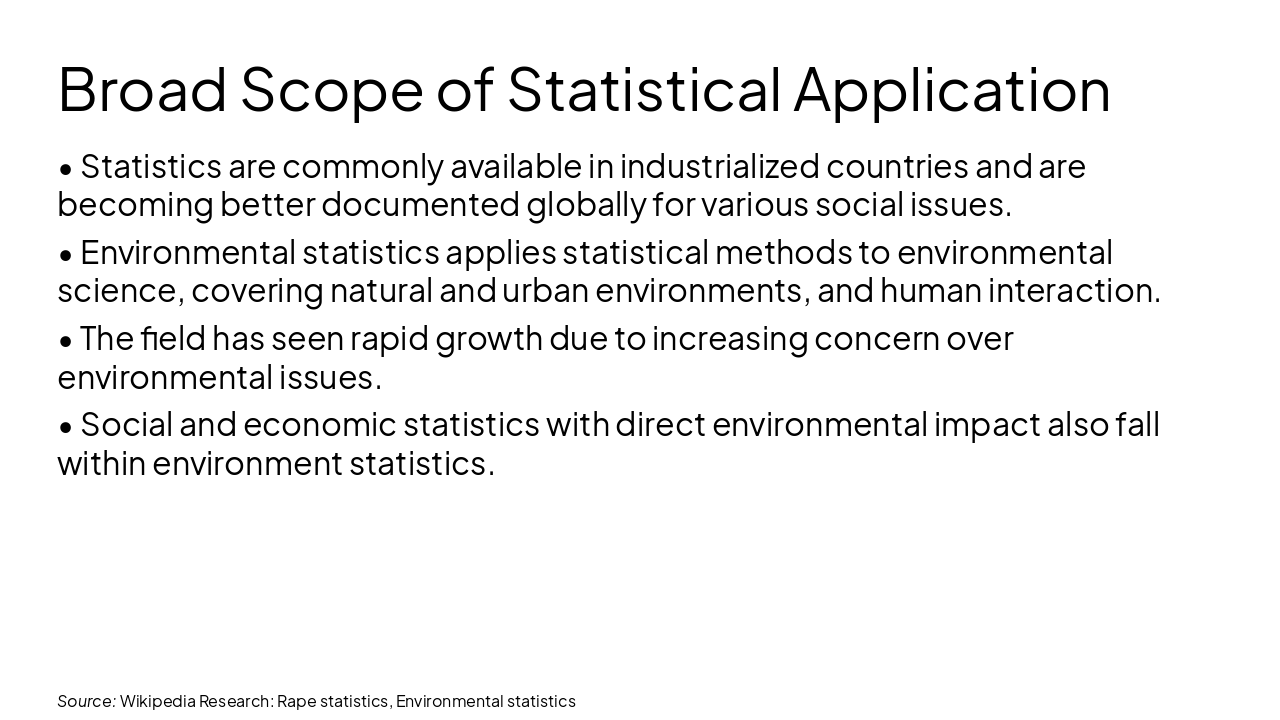
Statistics in Various Fields

---

Photo by Annie Spratt on Unsplash

Slide 11 - Applications of Statistics
Slide 12 of 15

Slide 12 - Diverse Applications

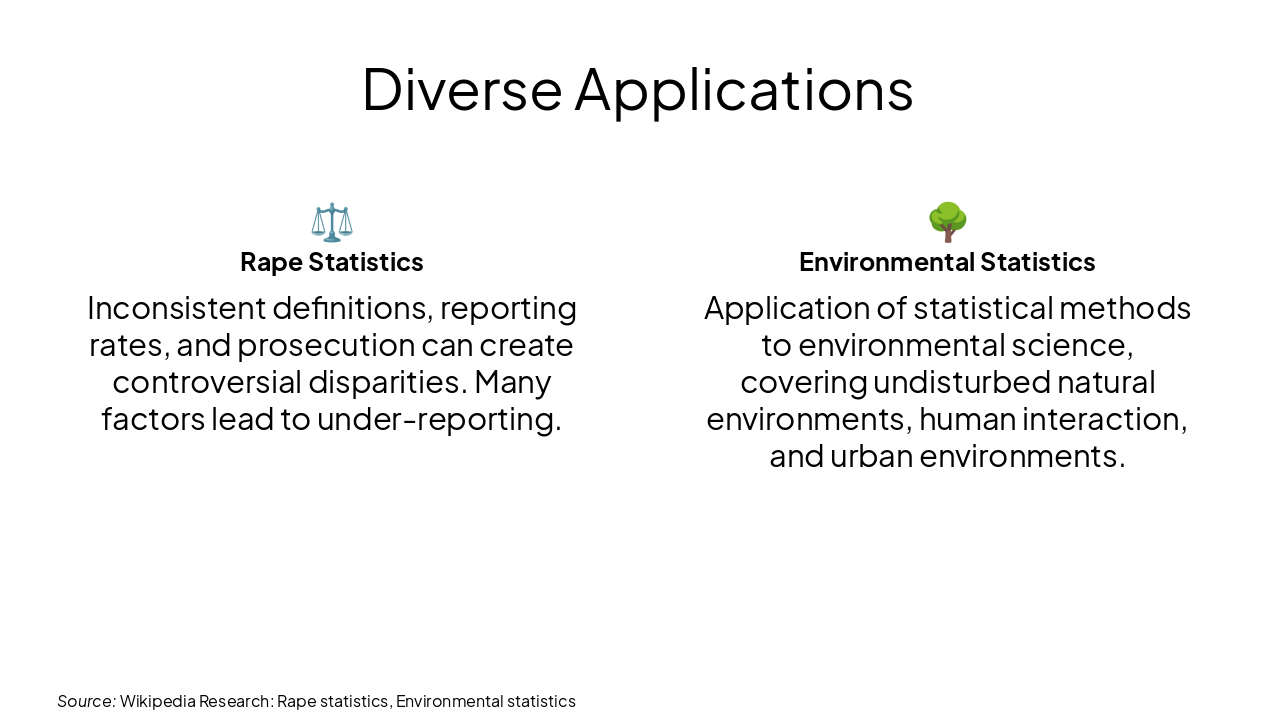
⚖️ Rape Statistics Inconsistent definitions, reporting rates, and prosecution can create controversial disparities. Many factors lead to under-reporting.

🌳 Environmental Statistics Application of statistical methods to environmental science, covering undisturbed natural environments, human interaction, and urban environments.

Source: Wikipedia Research: Rape statistics, Environmental statistics

Slide 12 - Diverse Applications
Slide 13 of 15

Slide 13 - Broad Scope of Statistical Application

  • Statistics are commonly available in industrialized countries and are becoming better documented globally for various social issues.
  • Environmental statistics applies statistical methods to environmental science, covering natural and urban environments, and human interaction.
  • The field has seen rapid growth due to increasing concern over environmental issues.
  • Social and economic statistics with direct environmental impact also fall within environment statistics.

Source: Wikipedia Research: Rape statistics, Environmental statistics

Slide 13 - Broad Scope of Statistical Application
Slide 14 of 15

Slide 14 - Conclusion

5

Conclusion

Key Takeaways

---

Photo by Sebastian Svenson on Unsplash

Slide 14 - Conclusion
Slide 15 of 15

Slide 15 - The Power of Statistics

Statistics is an indispensable discipline for understanding and interpreting the world around us.

From data collection to complex analysis, it provides the tools to make informed decisions and draw meaningful conclusions across science, industry, and society.

---

Photo by Conny Schneider on Unsplash

Slide 15 - The Power of Statistics

Discover More Presentations

Explore thousands of AI-generated presentations for inspiration

Browse Presentations
Powered by AI

Create Your Own Presentation

Generate professional presentations in seconds with Karaf's AI. Customize this presentation or start from scratch.

Create New Presentation

Powered by Karaf.ai — AI-Powered Presentation Generator