Slide 1 of 15
Slide 1 - Retail Allocation Monitoring
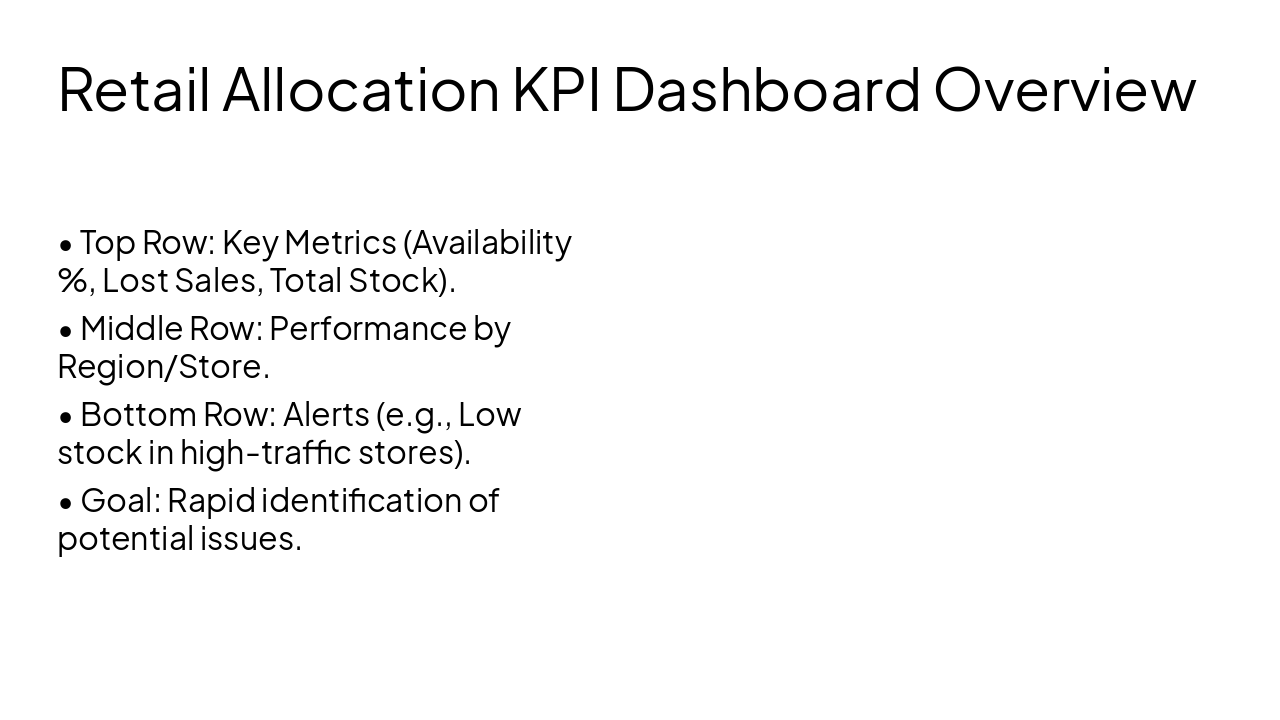
Retail Allocation Monitoring: SOH & EMT
Optimizing Inventory Flow, Availability, and Store Performance
Generated from prompt:
Restyle and redesign the uploaded presentation 'Retail Allocation Monitoring – SOH & EMT' into a clean professional business template with modern layout, icons, diagrams, and visual elements. Slides should include: Title Slide, Role of Allocation in Retail, Stock Cover (SOH) Overview, Objectives of Stock Cover Monitoring, Stock Cover Example (diagram), Stock Validity Analysis (visual split valid vs invalid), Execution Monitoring Template (EMT) overview, AGVT Framework diagram (Assortment-Group-Variety-Target), Variety Alignment example visual, Freshness Monitoring explanation with chart concept, Freshness Impact after IT-UP Stock, Store Prioritization Logic flowchart, Retail Allocation KPI Dashboard visual, Inventory Lifecycle diagram (Warehouse → IT-UP Dispatch → Store Receiving → Store Sales → Replenishment), Business Impact of Allocation Monitoring summary. Use business consulting style similar to McKinsey/BCG slides with editable placeholders and image suggestions.
This deck delves into retail allocation strategies using Stock-on-Hand (SOH) and Execution Monitoring Template (EMT). It covers the strategic role of allocation, stock cover analysis, validity checks, AGVT framework, freshness monitoring, store prior
Retail Allocation Monitoring: SOH & EMT
Optimizing Inventory Flow, Availability, and Store Performance
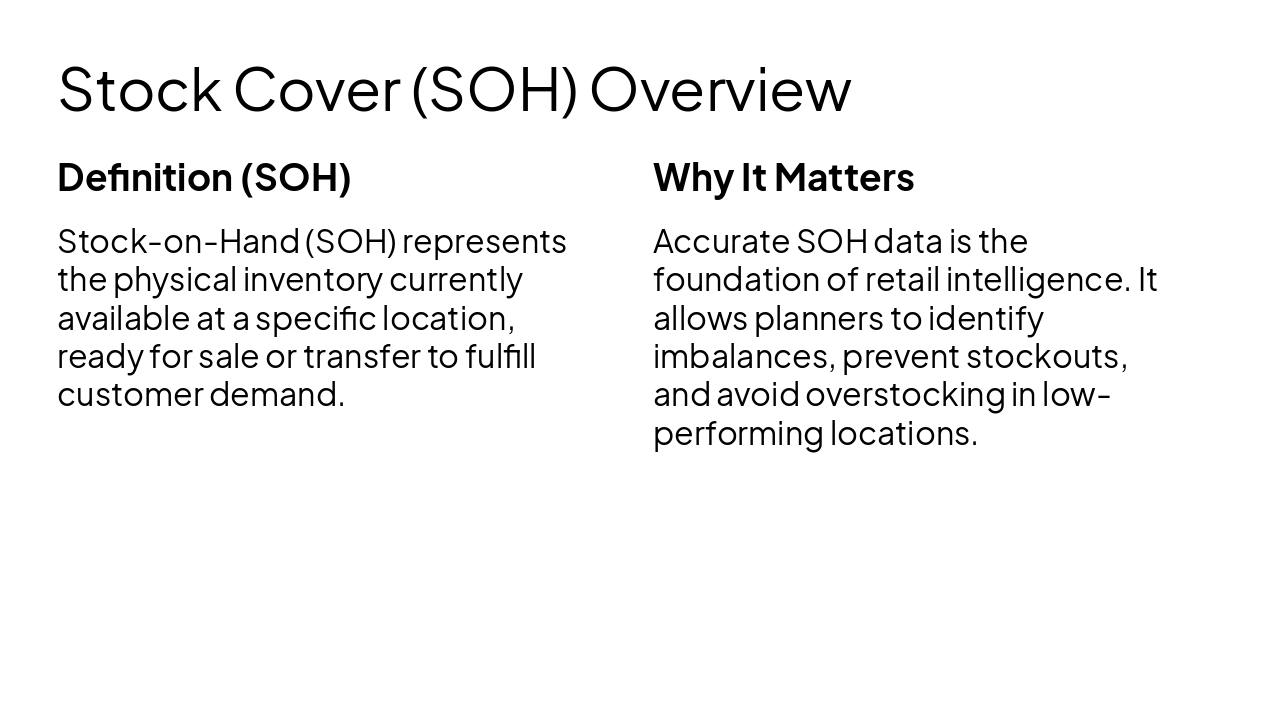
Definition (SOH) Stock-on-Hand (SOH) represents the physical inventory currently available at a specific location, ready for sale or transfer to fulfill customer demand.
Why It Matters Accurate SOH data is the foundation of retail intelligence. It allows planners to identify imbalances, prevent stockouts, and avoid overstocking in low-performing locations.
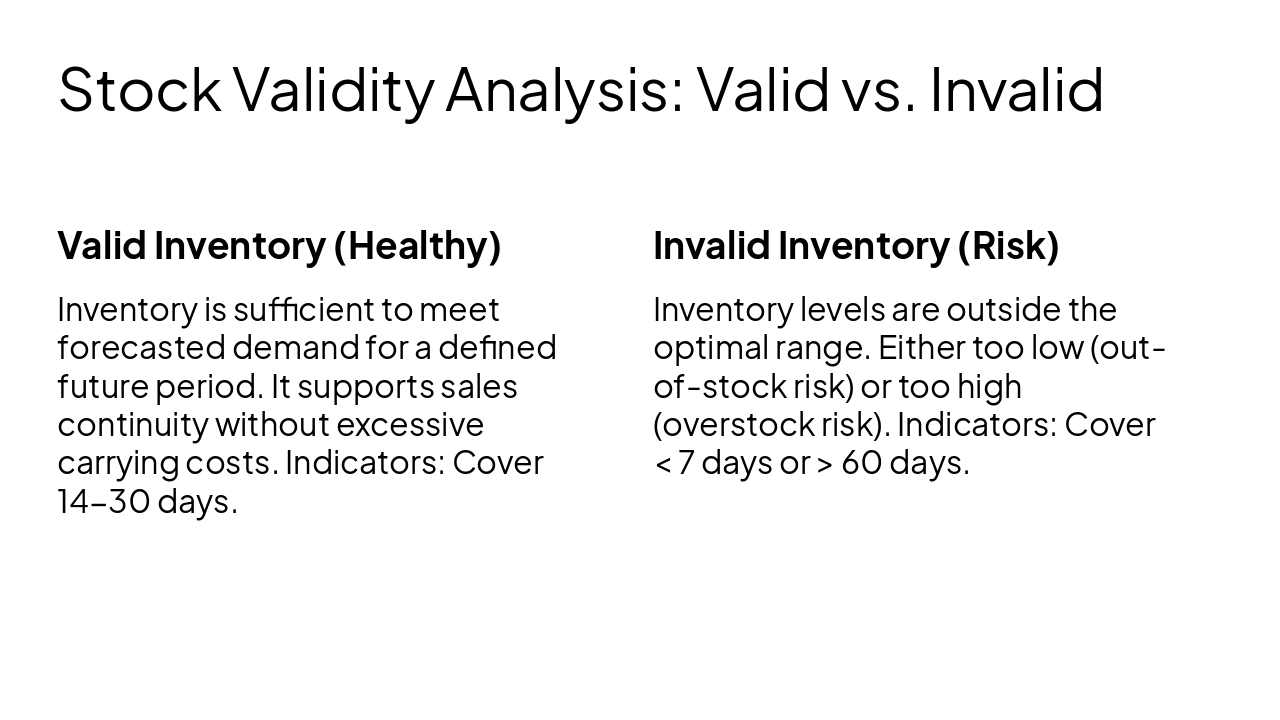
Valid Inventory (Healthy) Inventory is sufficient to meet forecasted demand for a defined future period. It supports sales continuity without excessive carrying costs. Indicators: Cover 14-30 days.
Invalid Inventory (Risk) Inventory levels are outside the optimal range. Either too low (out-of-stock risk) or too high (overstock risk). Indicators: Cover < 7 days or > 60 days.
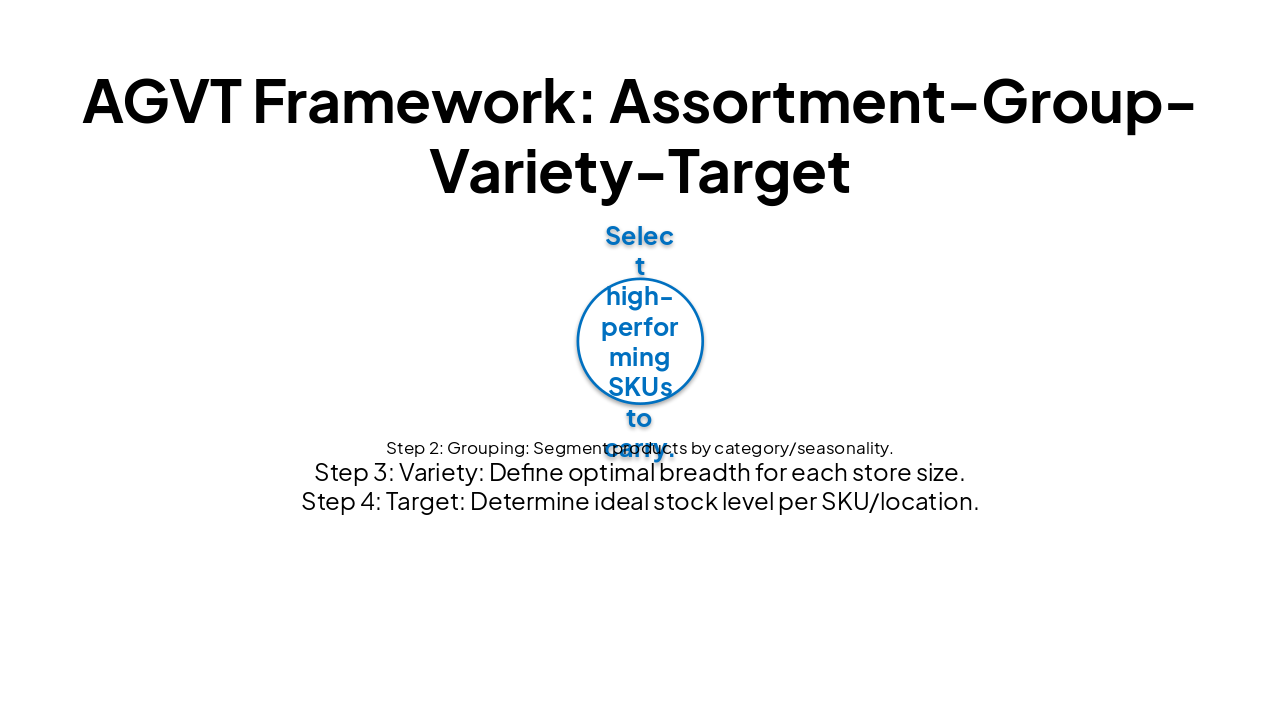
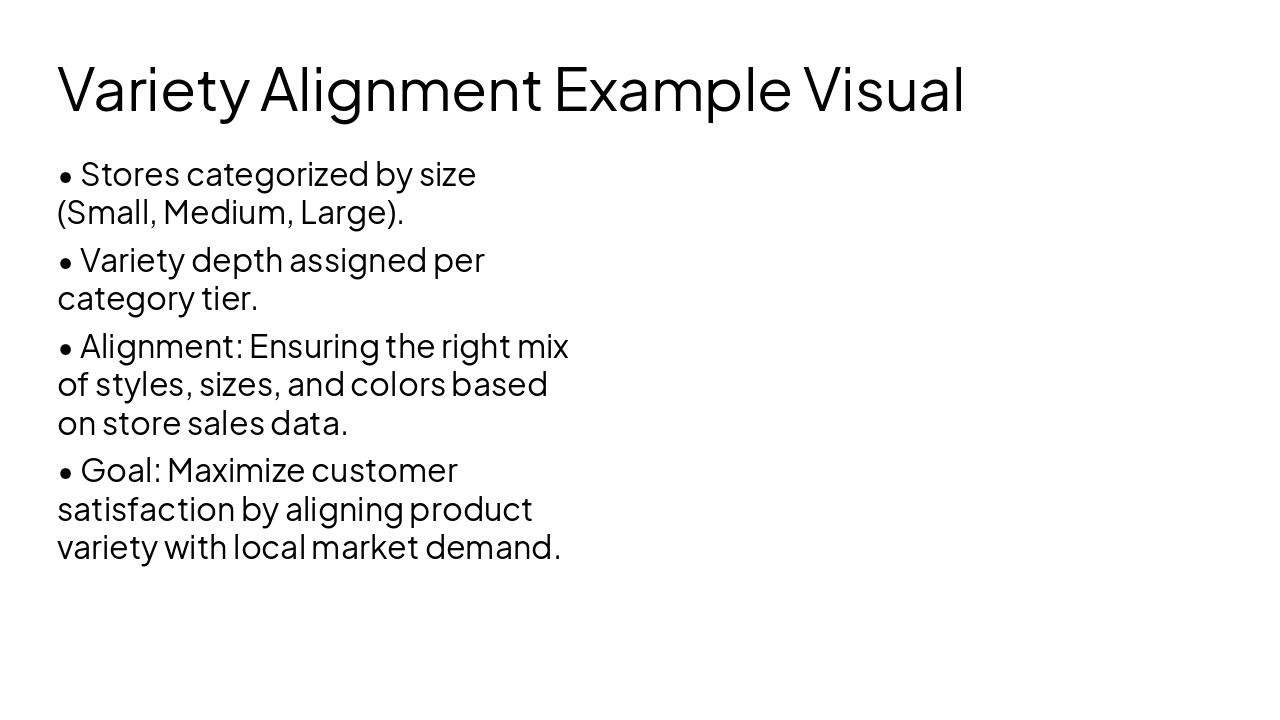
| Step 1: Assortment | Step 2: Grouping | Step 3: Variety | Step 4: Target |
|---|---|---|---|
| Select high-performing SKUs to carry. | Segment products by category/seasonality. | Define optimal breadth for each store size. | Determine ideal stock level per SKU/location. |
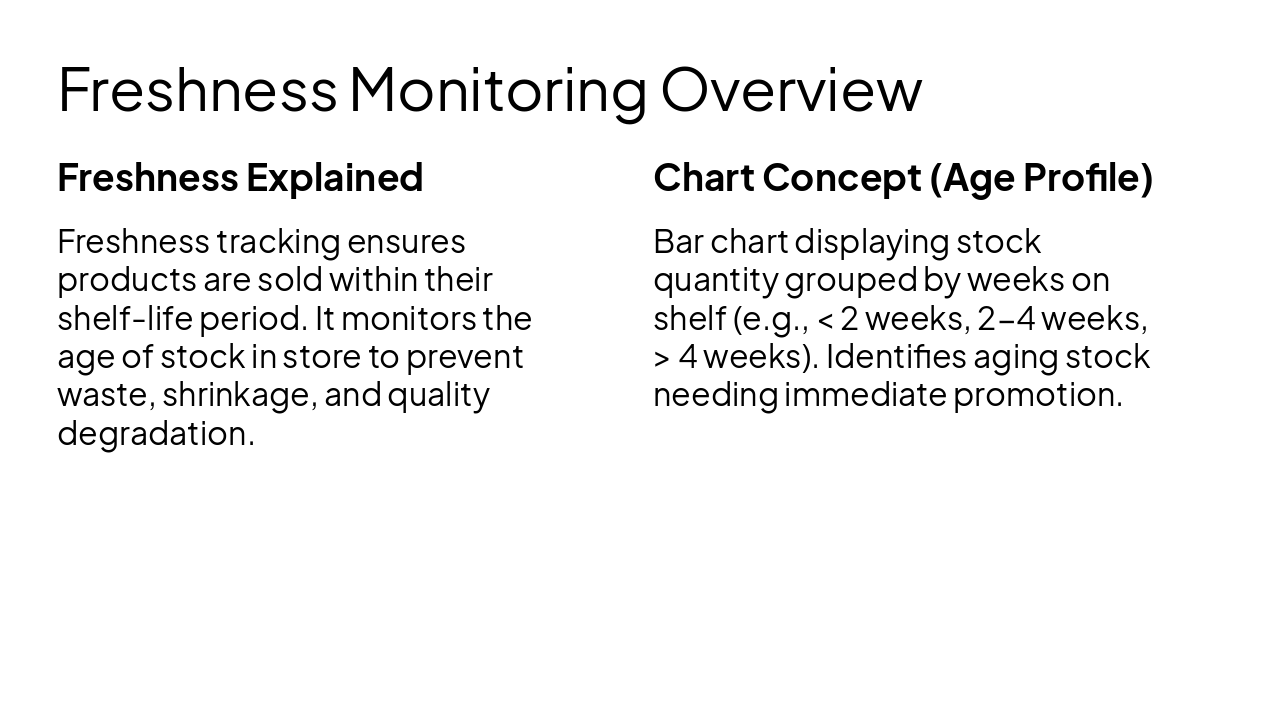
Freshness Explained Freshness tracking ensures products are sold within their shelf-life period. It monitors the age of stock in store to prevent waste, shrinkage, and quality degradation.
Chart Concept (Age Profile) Bar chart displaying stock quantity grouped by weeks on shelf (e.g., < 2 weeks, 2-4 weeks, > 4 weeks). Identifies aging stock needing immediate promotion.
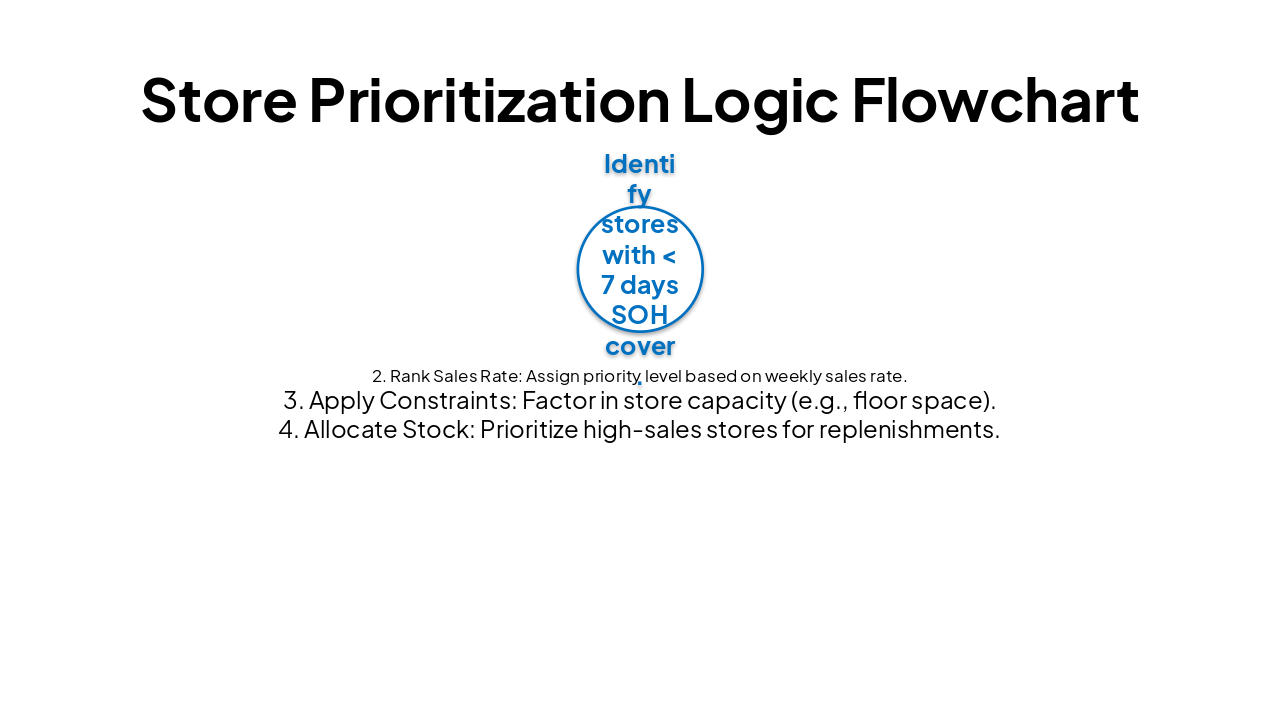
| 1. Inventory Check | 2. Rank Sales Rate | 3. Apply Constraints | 4. Allocate Stock |
|---|---|---|---|
| Identify stores with < 7 days SOH cover. | Assign priority level based on weekly sales rate. | Factor in store capacity (e.g., floor space). | Prioritize high-sales stores for replenishments. |
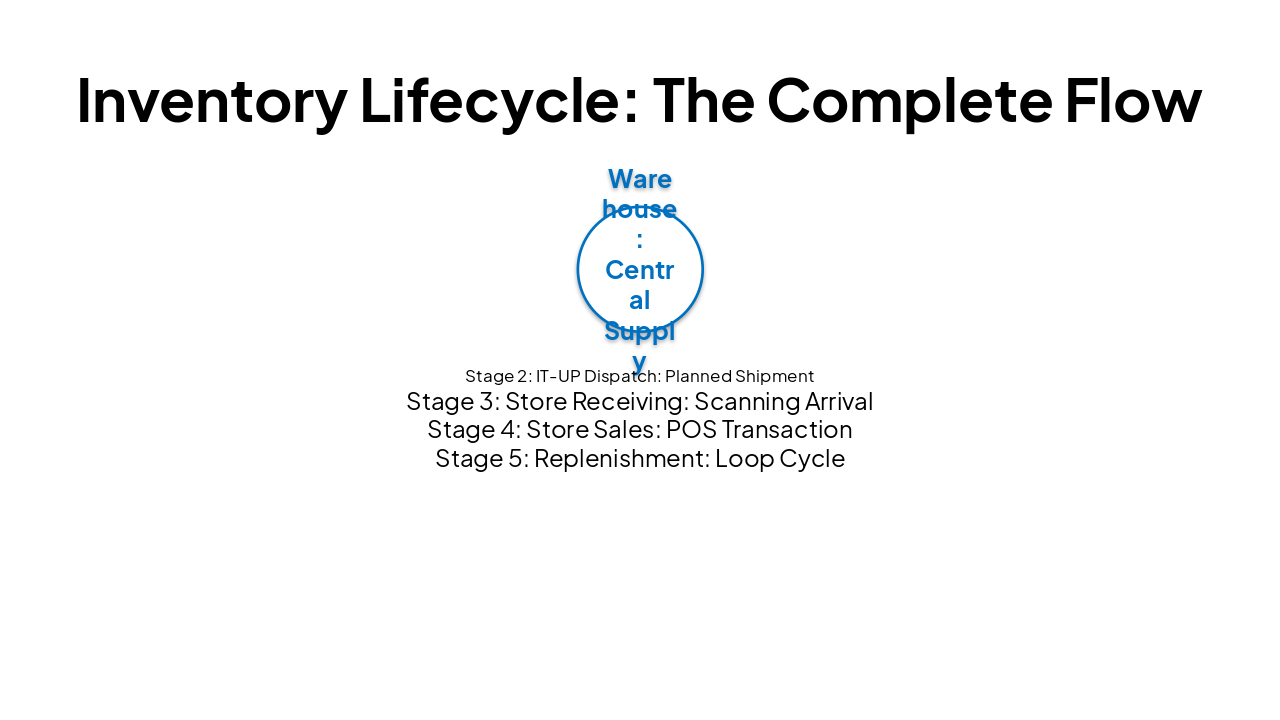
| Stage 1 | Stage 2 | Stage 3 | Stage 4 | Stage 5 |
|---|---|---|---|---|
| Warehouse: Central Supply | IT-UP Dispatch: Planned Shipment | Store Receiving: Scanning Arrival | Store Sales: POS Transaction | Replenishment: Loop Cycle |
Business Impact Summary: Driving Value through Monitoring
Effective allocation transforms supply chain data into competitive advantage. Consistent monitoring drives sales, optimizes costs, and elevates customer experience.

Explore thousands of AI-generated presentations for inspiration
Generate professional presentations in seconds with Karaf's AI. Customize this presentation or start from scratch.