Tesco: Strategic Analysis & Future Outlook

Generated from prompt:

Enhance the uploaded PowerPoint file located at /mnt/data/Tesco final presentation .pptx. Keep EXACT same colors and text. Improve layout, typography, spacing, alignment, add subtle icons and modern design consistency. Maintain all content unchanged. Output a polished professional version.

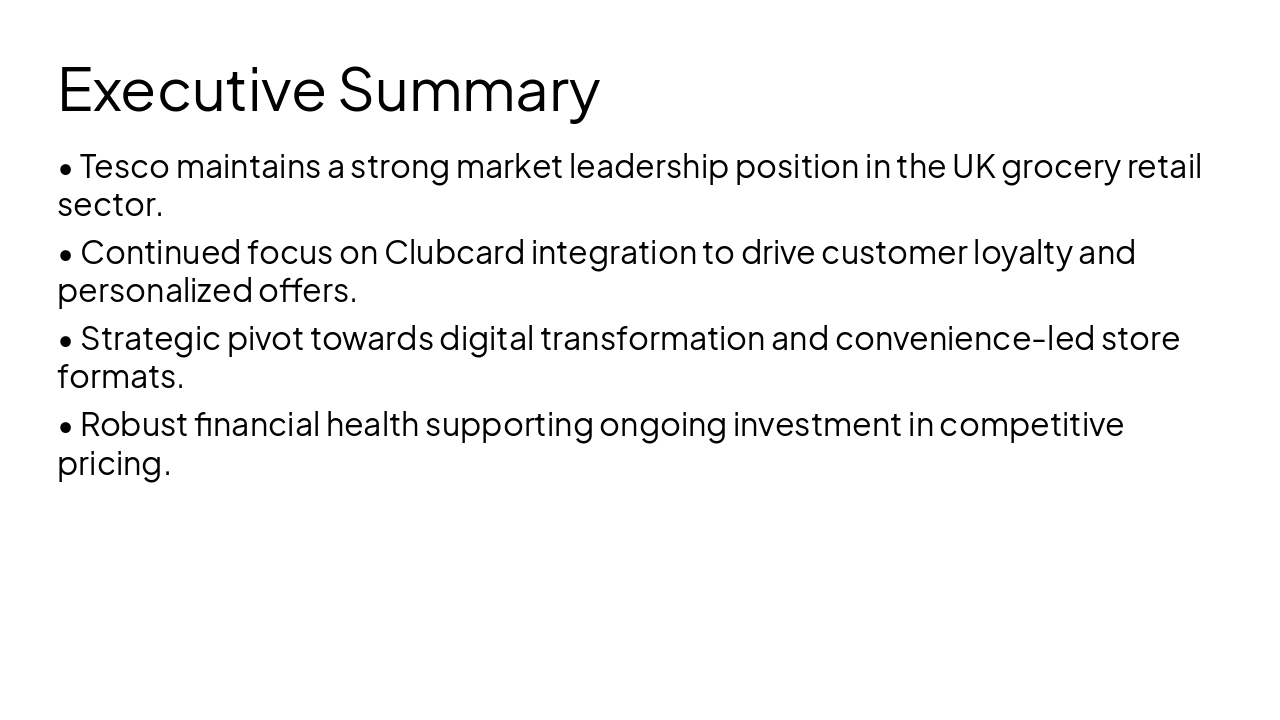
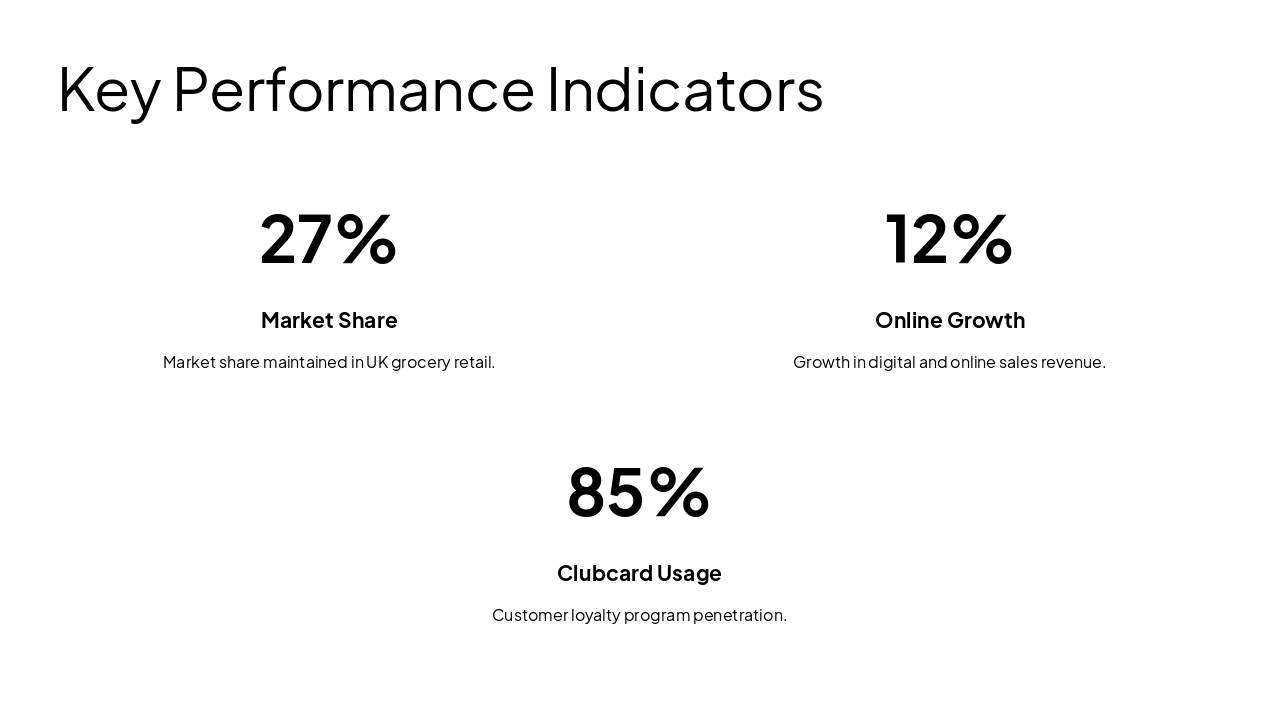
Comprehensive strategic review of Tesco's UK grocery market leadership, featuring executive summary, SWOT analysis, key performance indicators like 27% market share and 12% online growth, financial health, and future roadmap focused on digital转型 and

April 21, 20266 slides
Slide 1 of 6

Slide 1 - Tesco Final Presentation

Tesco Final Presentation

Strategic Analysis and Future Outlook
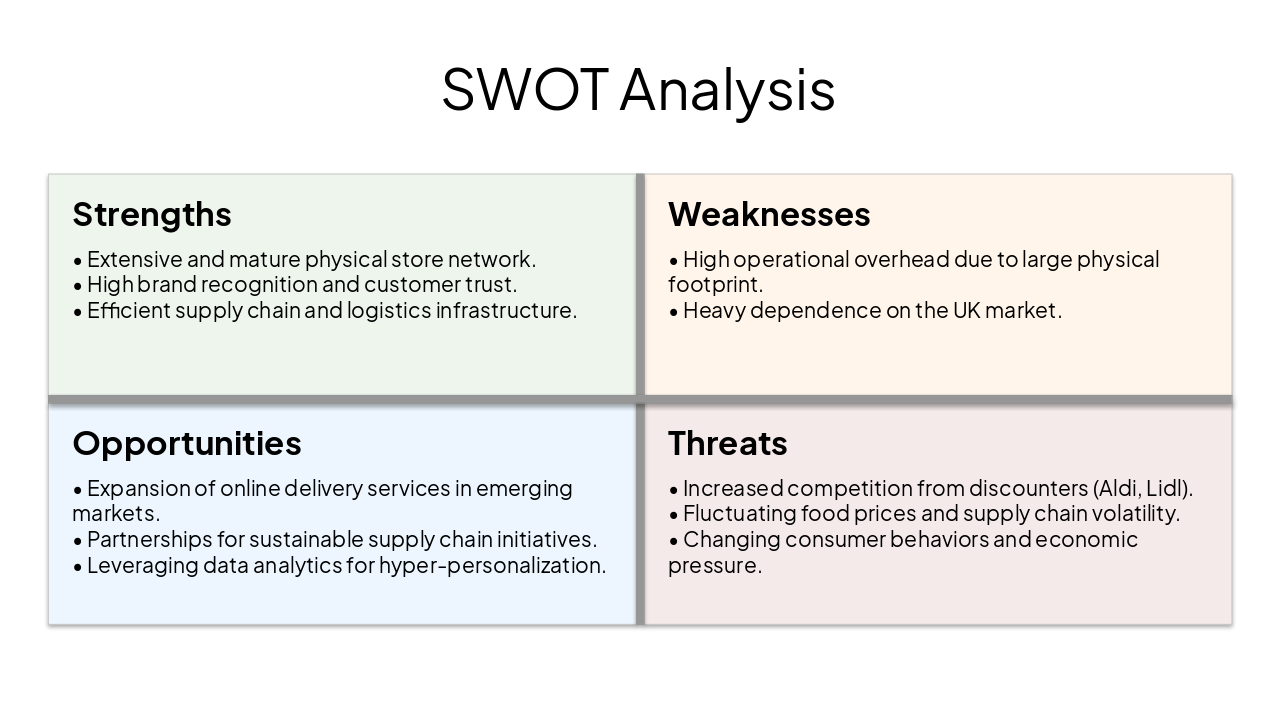
Slide 1 - Tesco Final Presentation
Slide 2 of 6

Slide 2 - Presentation Agenda

  • Executive Summary
  • Market Analysis
  • Strategic Positioning
  • Financial Performance
  • Future Roadmap
Slide 2 - Presentation Agenda
Slide 3 of 6

Slide 3 - Executive Summary

  • Tesco maintains a strong market leadership position in the UK grocery retail sector.
  • Continued focus on Clubcard integration to drive customer loyalty and personalized offers.
  • Strategic pivot towards digital transformation and convenience-led store formats.
  • Robust financial health supporting ongoing investment in competitive pricing.
Slide 3 - Executive Summary
Slide 4 of 6

Slide 4 - SWOT Analysis

Strengths

  • Extensive and mature physical store network.
  • High brand recognition and customer trust.
  • Efficient supply chain and logistics infrastructure.

Weaknesses

  • High operational overhead due to large physical footprint.
  • Heavy dependence on the UK market.

Opportunities

  • Expansion of online delivery services in emerging markets.
  • Partnerships for sustainable supply chain initiatives.
  • Leveraging data analytics for hyper-personalization.

Threats

  • Increased competition from discounters (Aldi, Lidl).
  • Fluctuating food prices and supply chain volatility.
  • Changing consumer behaviors and economic pressure.
Slide 4 - SWOT Analysis
Slide 5 of 6

Slide 5 - Key Performance Indicators

  • 27%: Market Share
  • 12%: Online Growth
  • 85%: Clubcard Usage
Slide 5 - Key Performance Indicators
Slide 6 of 6

Slide 6 - Conclusion

Delivering value for customers, communities, and shareholders.

Thank you for your time. Questions?

Slide 6 - Conclusion

Discover More Presentations

Explore thousands of AI-generated presentations for inspiration

Browse Presentations
Powered by AI

Create Your Own Presentation

Generate professional presentations in seconds with Karaf's AI. Customize this presentation or start from scratch.

Create New Presentation

Powered by Karaf.ai — AI-Powered Presentation Generator