Slide 1 of 14
Slide 1 - OBU BSc Applied Accounting RAP
Analyse and evaluate the business and financial performance of Eli Lilly and Company (2023–2025)
RAP Topic 5 | Period 52 | ACCA 2783998
Generated from prompt:
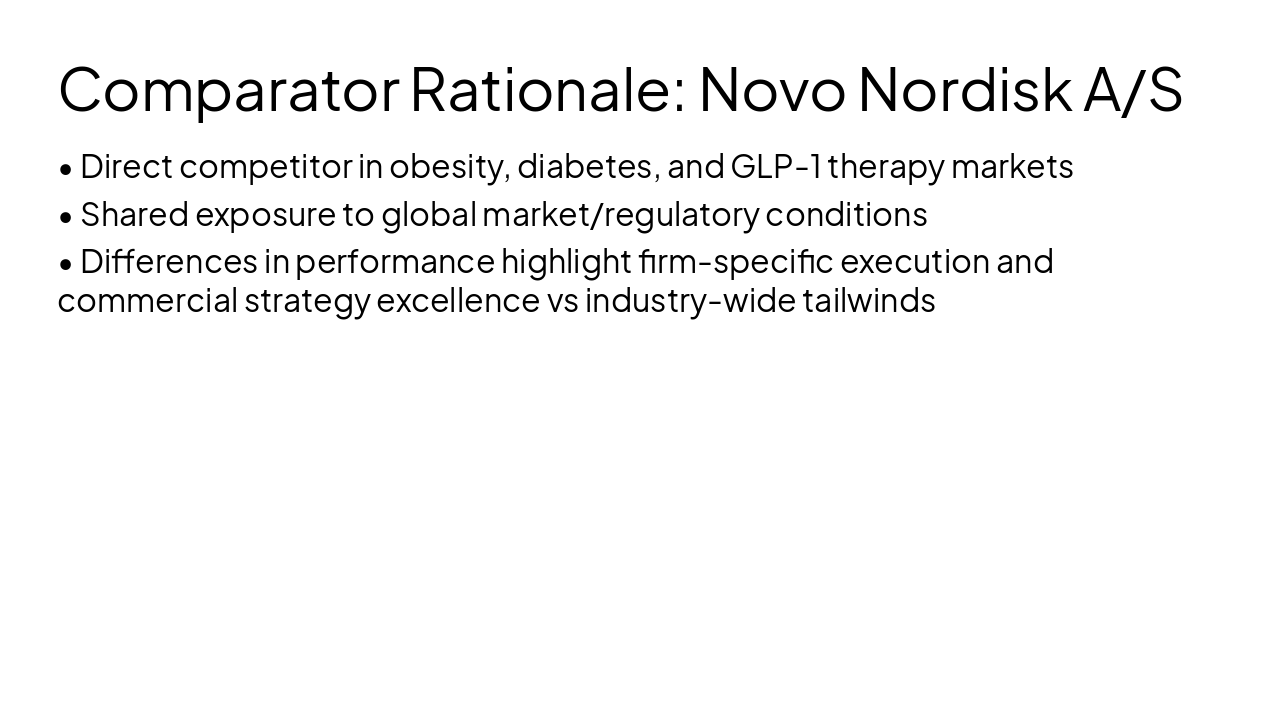
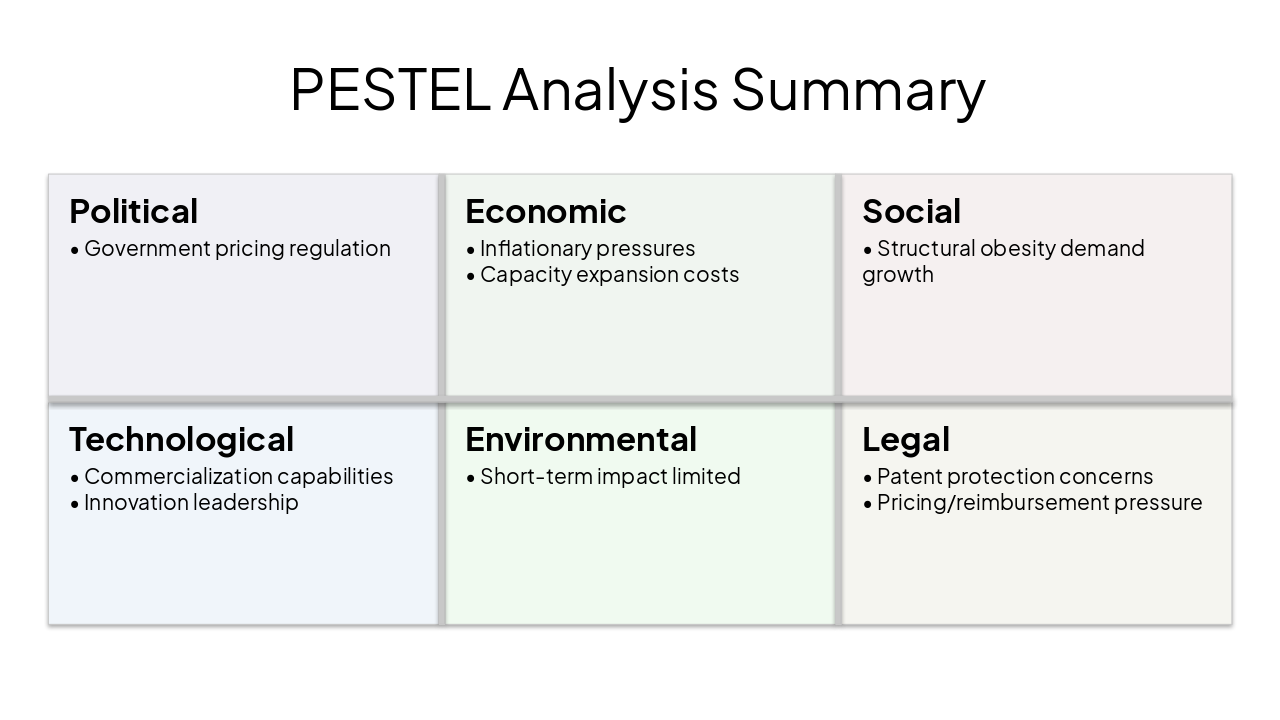
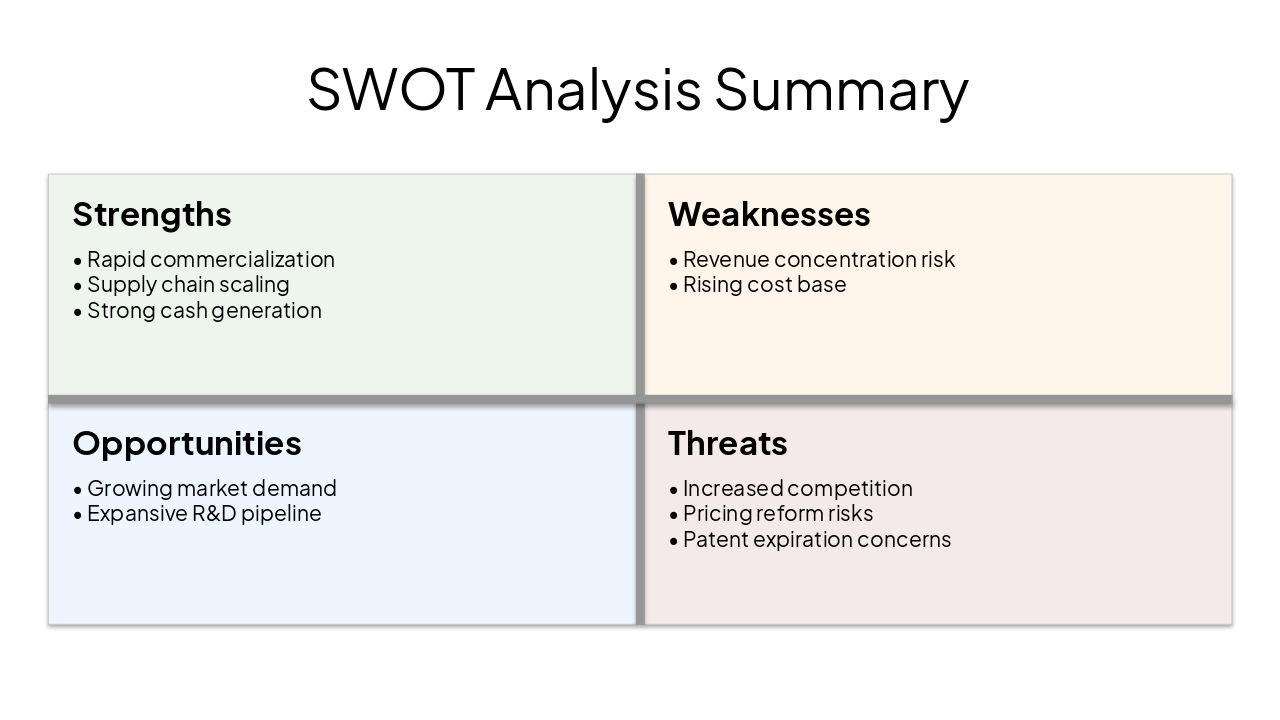
Create an original 14-slide PowerPoint for an Oxford Brookes University BSc Applied Accounting RAP mentor presentation. Use a clean academic style: white/light background, subtle Eli Lilly red accents, original layout, readable charts, concise bullets, no generic template feel, no stock-photo clutter. Audience: RAP mentor/assessor. Use ACCA number only: 2783998. Submission period: 52. No personal name. Topic title: Analyse and evaluate the business and financial performance of Eli Lilly and Company, which performed exceptionally well over 2023–2025, with a critical analysis of the reasons for its success. Comparator: Novo Nordisk A/S. Oxford Brookes framing to reflect: 10–20 slides, analysis/evaluation/conclusions over process, graphs/charts included, explicitly show why performance was exceptionally strong, anonymous style. Slide outline: 1) Title slide: OBU, RAP, Topic 5, title, ACCA 2783998, Period 52. 2) Aim and objectives: evaluate Eli Lilly 2023–2025, compare with Novo, use PESTLE/SWOT/ratios, assess sustainability. 3) Why exceptionally strong: show KPI summary with Lilly revenue 34,124 (2023), 45,043 (2024), 65,179 (2025); net income 5,240, 10,590, 20,640; diluted EPS 5.80, 11.71, 22.95; operating cash flow 4,240, 8,818, 16,813. Message: strong sales, profit, cash and returns. 4) Research approach/models: secondary data, annual reports + industry sources, PESTLE, SWOT, ratio analysis, industry KPIs. 5) Comparator rationale: Novo in same obesity/diabetes/GLP-1 space, similar market/regulatory conditions, so differences suggest firm-specific execution. 6) PESTLE summary: pricing/reimbursement pressure; inflation and capacity costs; structural obesity/diabetes demand; technology + commercialization as key differentiator; environment less important short term. Conclude both had similar tailwinds, so Lilly’s gap implies stronger execution. 7) SWOT summary: strengths rapid commercialization, manufacturing/supply scaling, cash generation; weaknesses concentration and rising cost base; opportunities demand and pipeline; threats competition, pricing reform, patents. 8) Revenue growth comparison: emphasize momentum not direct currency comparison. Lilly revenue 34,124 / 45,043 / 65,179 USD m. Novo 2025 sales DKK 309,064m, +6% reported. Key message: Lilly accelerated faster. 9) Product-sales momentum: Mounjaro 11,540 to 22,965 (+99%); Zepbound 4,926 to 13,542 (+175%); Novo Ozempic 127,089 DKK in 2025 (+6%); Rybelsus 22,093 DKK (-5%); obesity care 82,347 DKK (+26%). Message: Lilly monetized demand faster. 10) Profitability/operating leverage: Lilly operating margin about 18.9% (2023), 28.6% (2024), 40.4% (2025); gross margin 83.0% in 2025 vs 81.3% in 2024; R&D 13,337 (+21%); marketing/selling/admin 11,094 (+29%). Message: rising investment but stronger profit conversion. 11) Capital productivity/liquidity: ROCE about 17.6%, 25.6%, 34.0%; current ratio about 0.94, 1.15, 1.58; current assets 55,629 and current liabilities 35,228 in 2025; OCF 16,813. Message: growth became cash-backed and scalable. 12) Revenue concentration/segment mix: 2024 Cardiometabolic 29,521; Oncology 8,752; Immunology 4,393; Neuroscience 1,474; Other 903. 2025 Cardiometabolic 48,221; Oncology 9,376; Immunology 5,247; Neuroscience 1,391; Other 944. Message: growth engine but concentration risk. 13) Critical evaluation: rank reasons—1 superior commercialization of innovation, 2 faster capture of structural demand, 3 operating leverage/scalable profitability, 4 product execution and supply readiness. Add balanced note that some advantage may reflect favorable timing/supply conditions. 14) Conclusion/limitations: Lilly outperformed because it executed better, not just because the market grew; it converted innovation into revenue, margins, cash flow and EPS faster than Novo; sustainability uncertain due to concentration, competition, pricing pressure, market normalization; limitations: secondary data, US GAAP vs IFRS, currency/reporting comparability. Make it polished and ready to rehearse from directly.
Comprehensive evaluation of Eli Lilly's exceptional business and financial performance (2023-2025), benchmarked against Novo Nordisk. Utilizes PESTEL, SWOT, financial ratios, and KPIs to assess growth drivers, profitability, sustainability, and key成功
Analyse and evaluate the business and financial performance of Eli Lilly and Company (2023–2025)
RAP Topic 5 | Period 52 | ACCA 2783998
Political
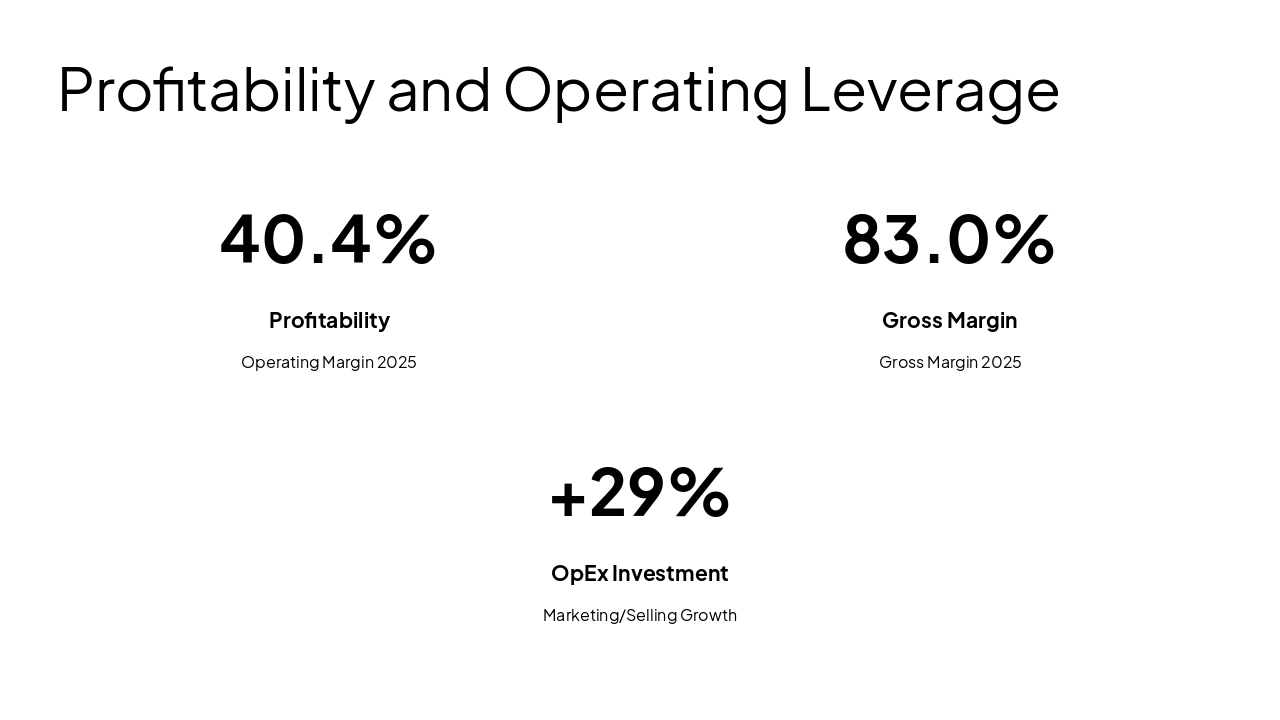
Economic
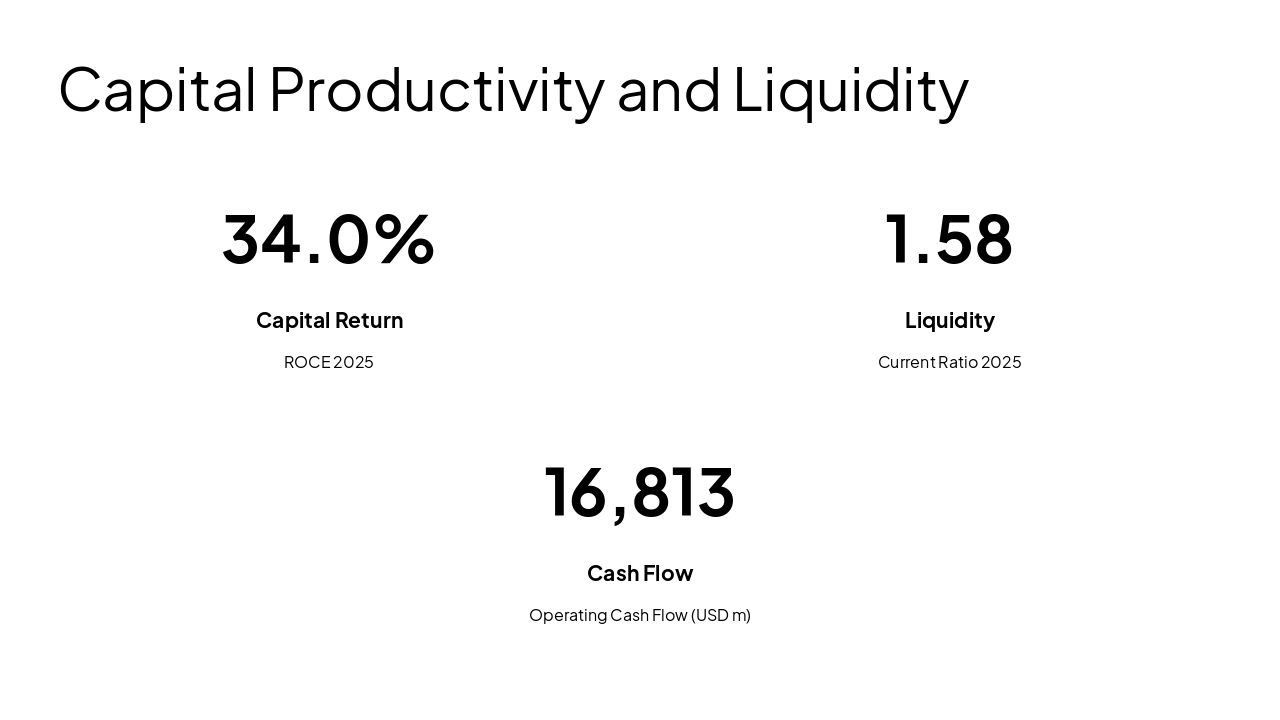
Social
Technological
Environmental
Legal
Strengths
Weaknesses
Opportunities
Threats
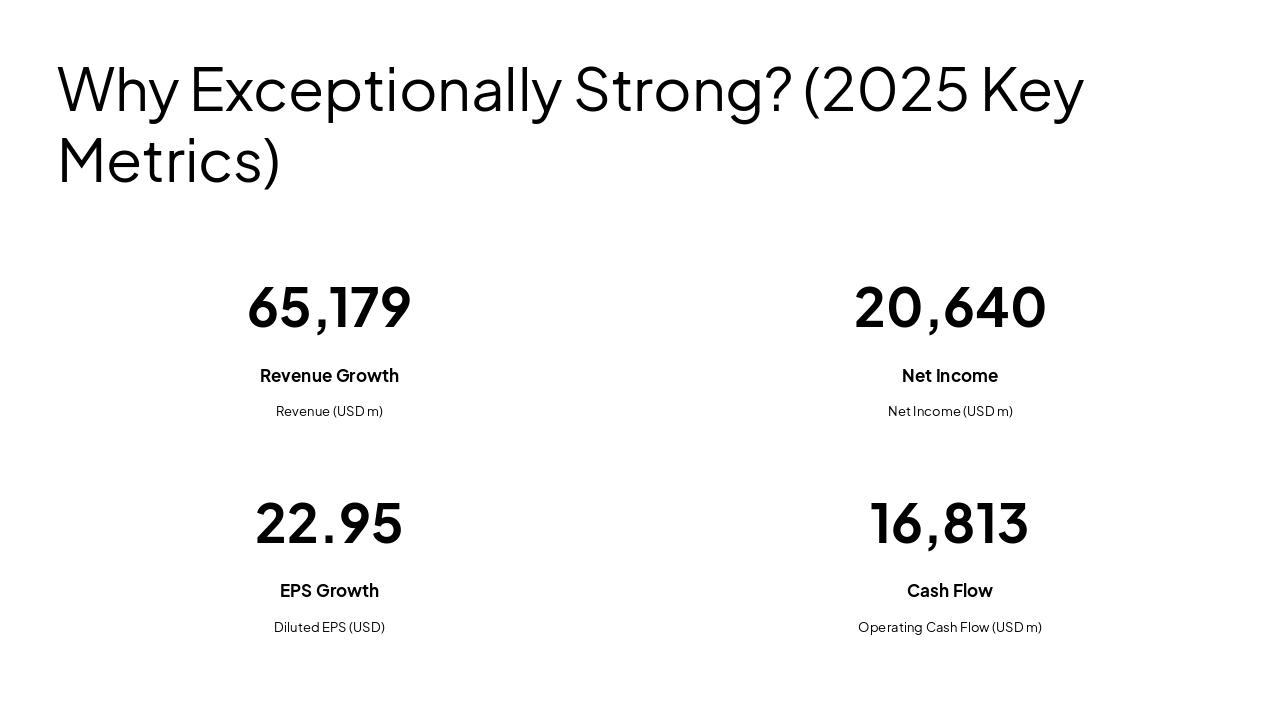
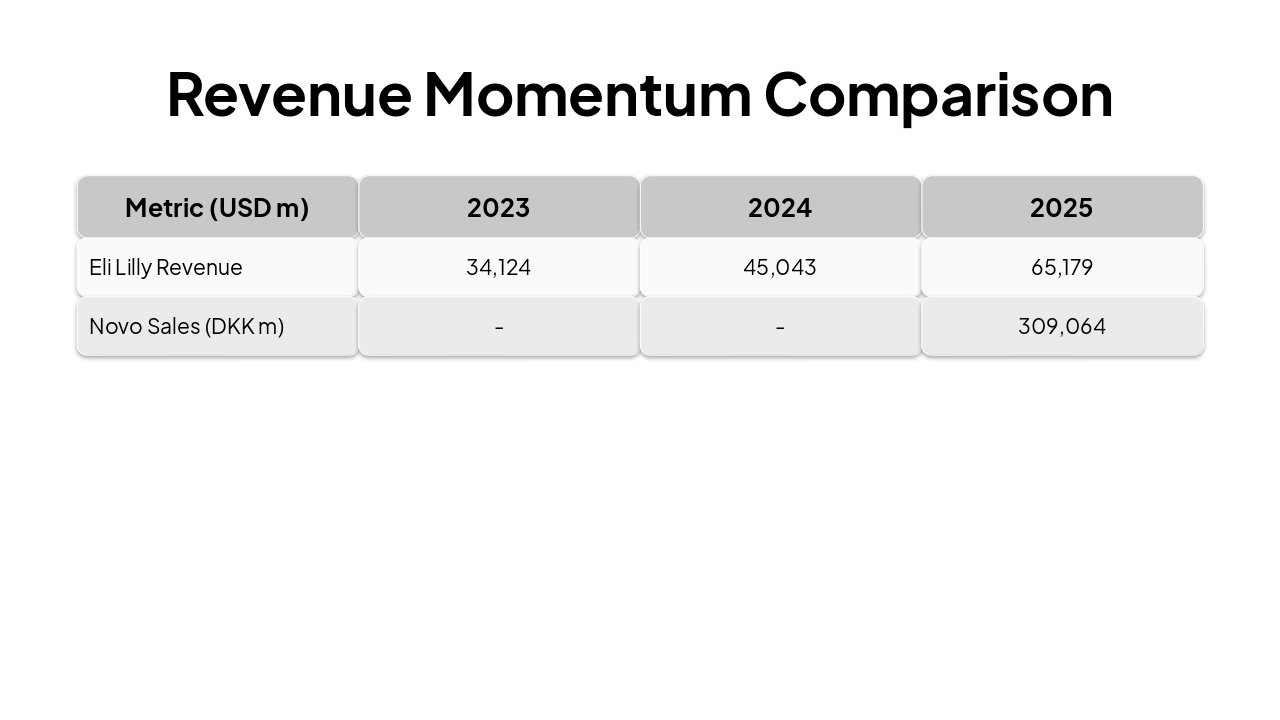
| Metric (USD m) | 2023 | 2024 | 2025 |
|---|---|---|---|
| Eli Lilly Revenue | 34,124 | 45,043 | 65,179 |
| Novo Sales (DKK m) | - | - | 309,064 |
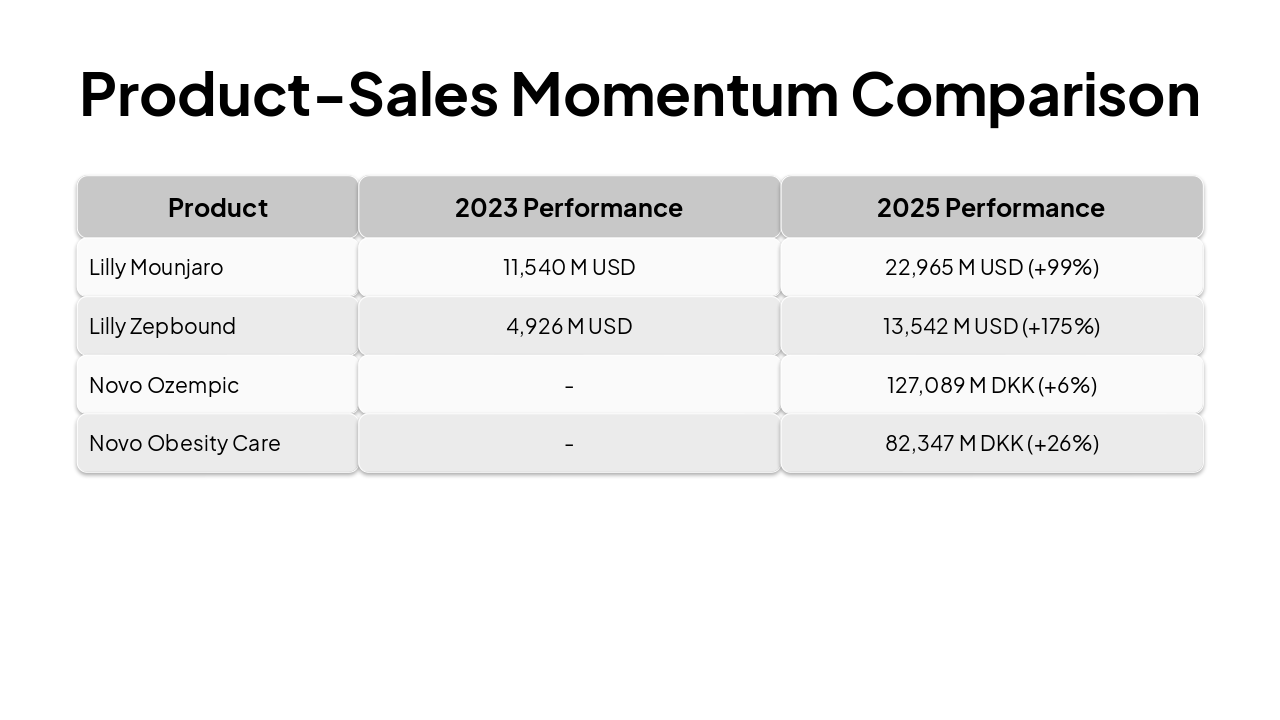
| Product | 2023 Performance | 2025 Performance |
|---|---|---|
| Lilly Mounjaro | 11,540 M USD | 22,965 M USD (+99%) |
| Lilly Zepbound | 4,926 M USD | 13,542 M USD (+175%) |
| Novo Ozempic | - | 127,089 M DKK (+6%) |
| Novo Obesity Care | - | 82,347 M DKK (+26%) |
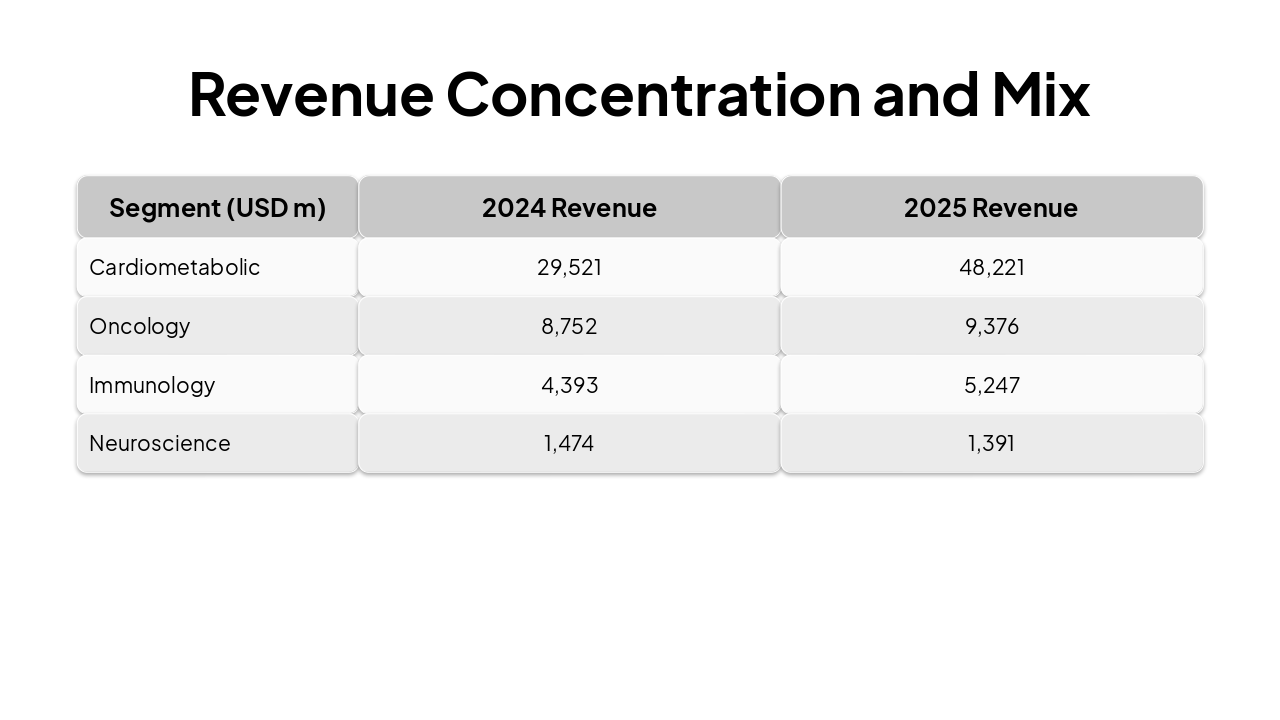
| Segment (USD m) | 2024 Revenue | 2025 Revenue |
|---|---|---|
| Cardiometabolic | 29,521 | 48,221 |
| Oncology | 8,752 | 9,376 |
| Immunology | 4,393 | 5,247 |
| Neuroscience | 1,474 | 1,391 |

Conclusion and Limitations
Eli Lilly outperformed through superior execution, converting innovation into margins, cash flow, and EPS faster than its comparator. Sustainability remains dependent on managing concentration, competition, and pricing. Limitations: Secondary data reliance, US GAAP vs IFRS, and currency reporting challenges.
Explore thousands of AI-generated presentations for inspiration
Generate professional presentations in seconds with Karaf's AI. Customize this presentation or start from scratch.