Slide 1 of 10
Slide 1 - Master the Spread! Unlock Stats Secrets
Master the Spread!
Unlock Stats Secrets
Fun Adventure in Descriptive Statistics
---
Photo by Hadyn Cutler on Unsplash
Generated from prompt:
Make a game presentation on interquartilrange
Dive into a gamified adventure in descriptive statistics! This deck covers what IQR is as a robust measure of data spread, step-by-step calculation, comparison to range, visualization with box plots, hands-on example challenges, key advantages over outliers, and a triumphant summary to equip you for data quests.
Master the Spread!
Unlock Stats Secrets
Fun Adventure in Descriptive Statistics
---
Photo by Hadyn Cutler on Unsplash
---
Photo by Nik Shuliahin 💛💙 on Unsplash
Source: Wikipedia: Interquartile range
---
Photo by Bozhin Karaivanov on Unsplash
Source: Wikipedia: Interquartile range
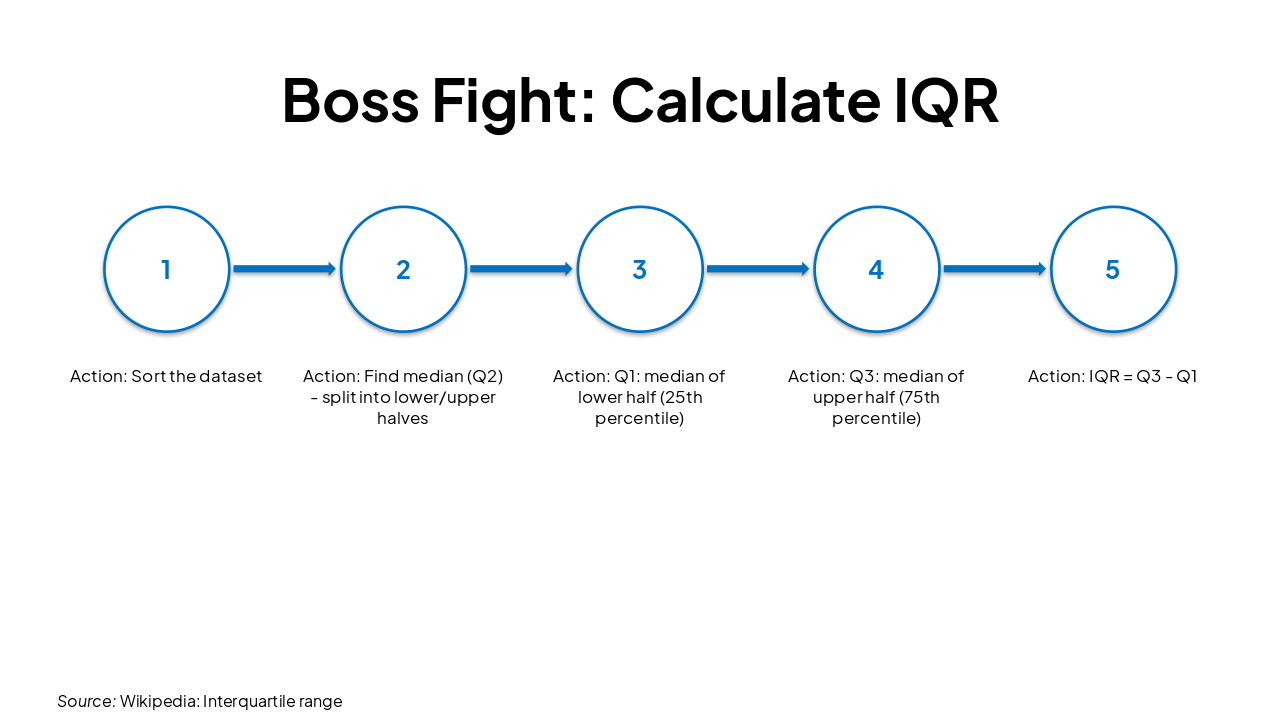
| Step | Action |
|---|---|
| 1 | Sort the dataset |
| 2 | Find median (Q2) - split into lower/upper halves |
| 3 | Q1: median of lower half (25th percentile) |
| 4 | Q3: median of upper half (75th percentile) |
| 5 | IQR = Q3 - Q1 |
Source: Wikipedia: Interquartile range
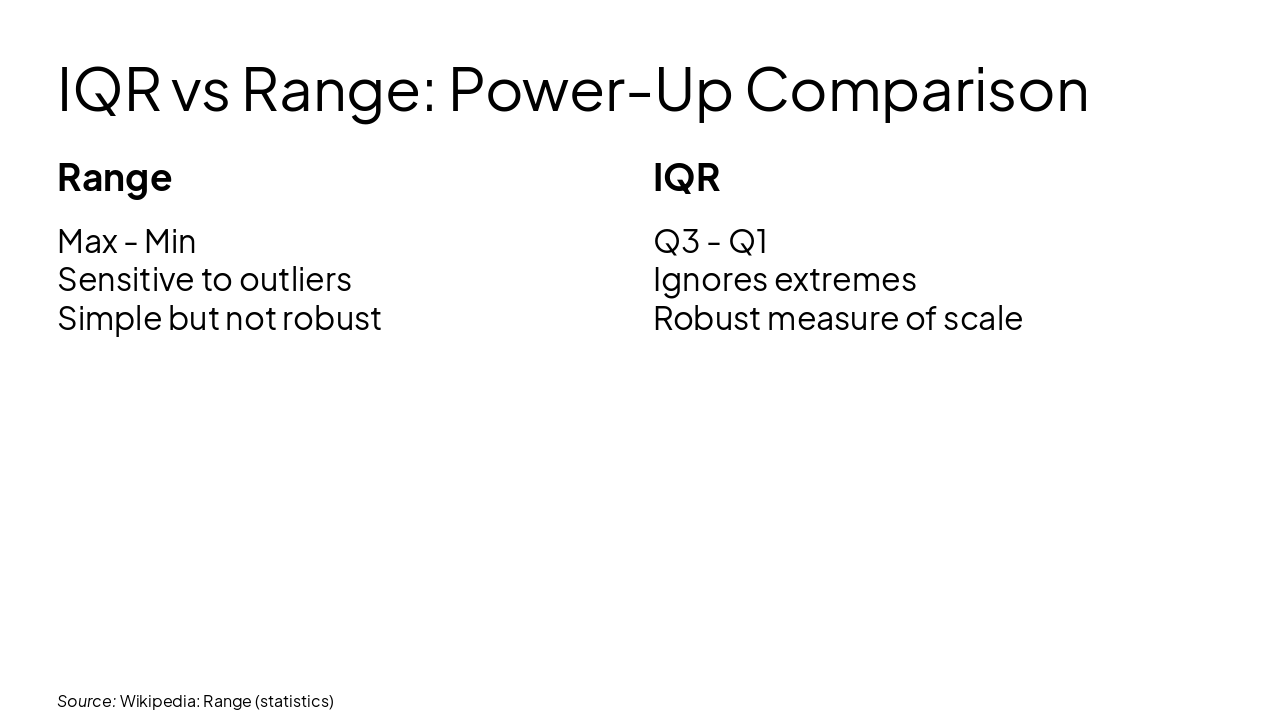
Range Max - Min Sensitive to outliers Simple but not robust
IQR Q3 - Q1 Ignores extremes Robust measure of scale
Source: Wikipedia: Range (statistics)
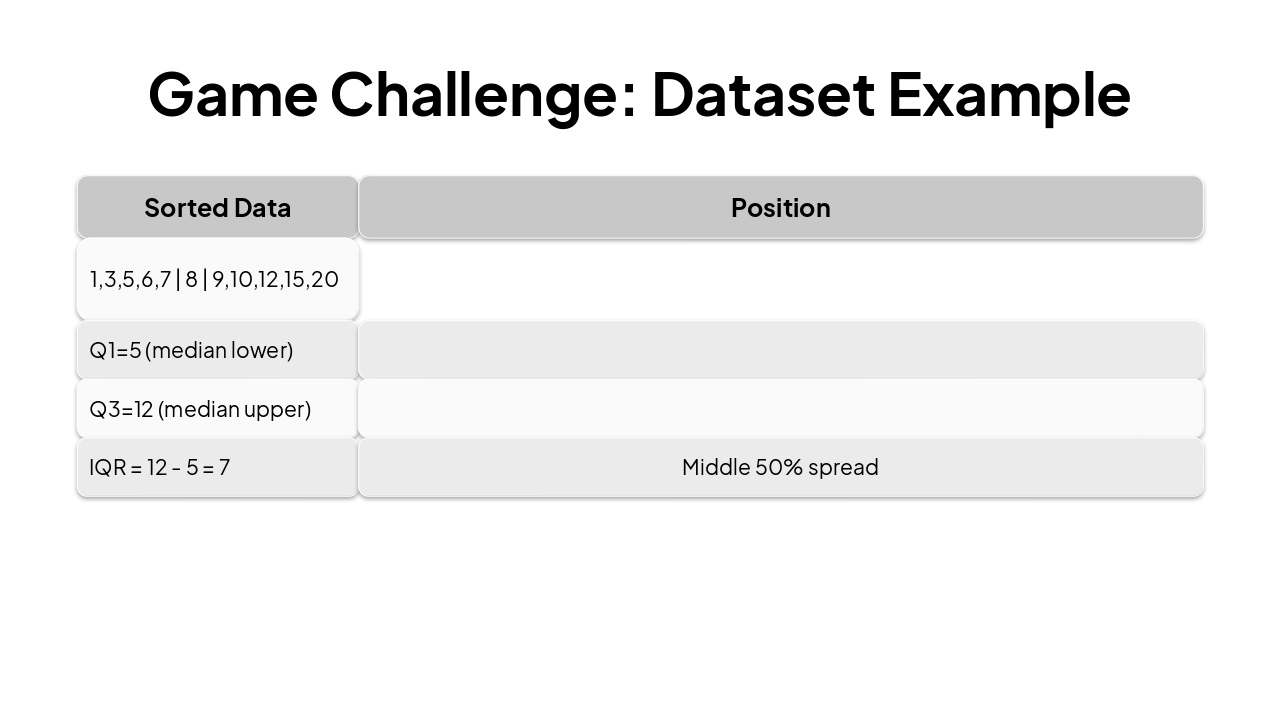
| Sorted Data | Position | |
|---|---|---|
| 1,3,5,6,7 | 8 | 9,10,12,15,20 |
| Q1=5 (median lower) | ||
| Q3=12 (median upper) | ||
| IQR = 12 - 5 = 7 | Middle 50% spread |
---
Photo by Senad Palic on Unsplash
Source: Wikipedia: Interquartile range
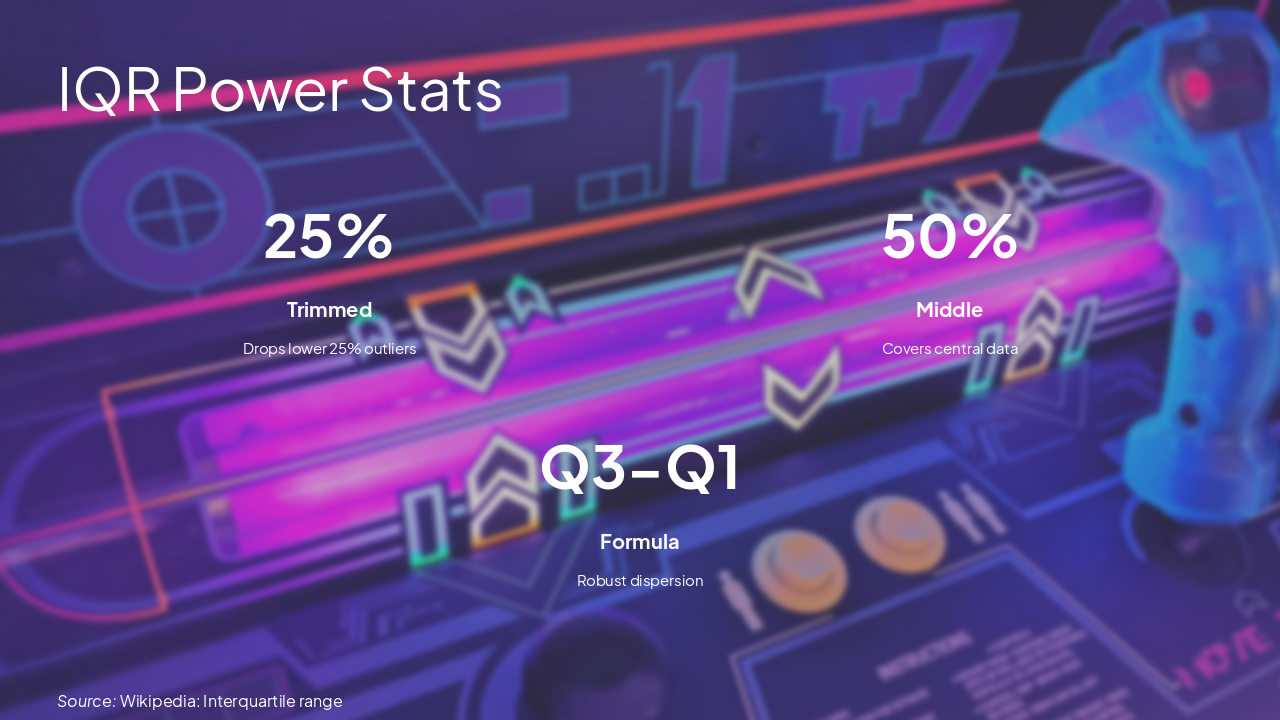
> The IQR is an example of a trimmed estimator... enhances accuracy by dropping outlying points. It is a robust measure of scale.
— Wikipedia
---
Photo by Jonathan Francisca on Unsplash
Source: Wikipedia: Interquartile range
You've mastered IQR!
Robust spread measure Visualized in box plots Ready for data adventures
Play again with real datasets!
---
Photo by Erika Mourão on Unsplash
Explore thousands of AI-generated presentations for inspiration
Generate professional presentations in seconds with Karaf's AI. Customize this presentation or start from scratch.