Slide 1 of 28
Slide 1 - Thesis Presentation
Literature Thesis Presentation
Investigating the chemical space coverage of liquid chromatographic techniques: how selectivity drives measurability
---
Photo by Nastuh Abootalebi on Unsplash

Generated from prompt:
Create a presenation about my thesis
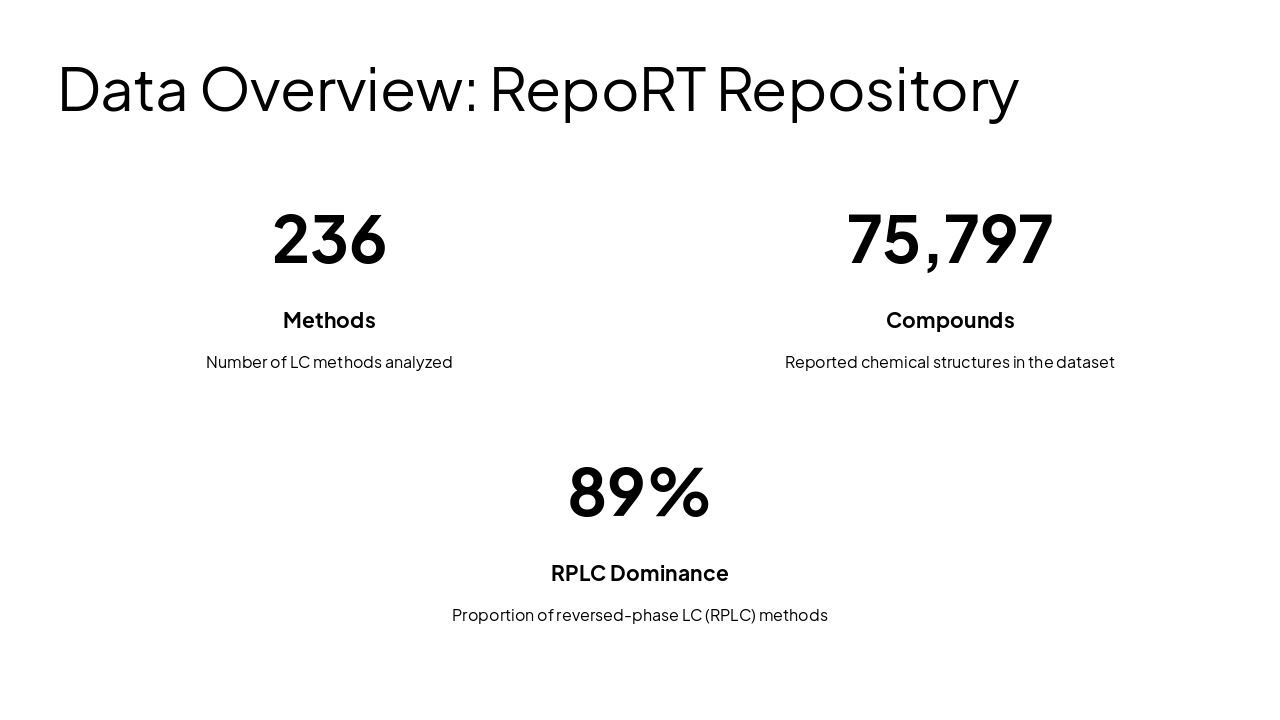
MSc literature thesis presentation investigating chemical space coverage by liquid chromatographic techniques (LC-HRMS) in non-targeted analysis. Analyzes 236 RepoRT methods, revealing RPLC/HILIC selectivity biases, coverage limitations, and need for
Literature Thesis Presentation
Investigating the chemical space coverage of liquid chromatographic techniques: how selectivity drives measurability
---
Photo by Nastuh Abootalebi on Unsplash
Literature Thesis Presentation
Investigating the chemical space coverage of liquid chromatographic techniques: how selectivity drives measurability
---
Photo by Nastuh Abootalebi on Unsplash
MSc Literature Thesis: Chemical Space Coverage in LC-HRMS
Investigating the chemical space coverage of liquid chromatographic techniques: how selectivity drives measurability
---
Photo by Nastuh Abootalebi on Unsplash

---
Photo by Tom Parkes on Unsplash
1
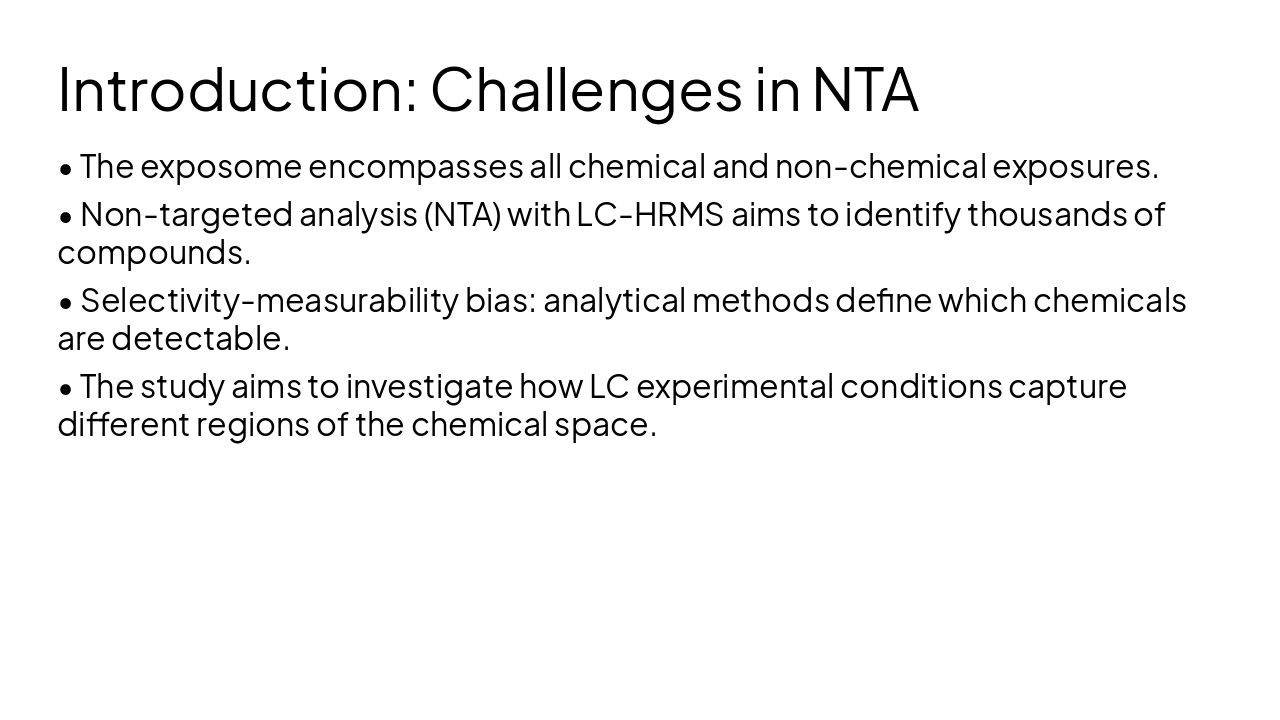
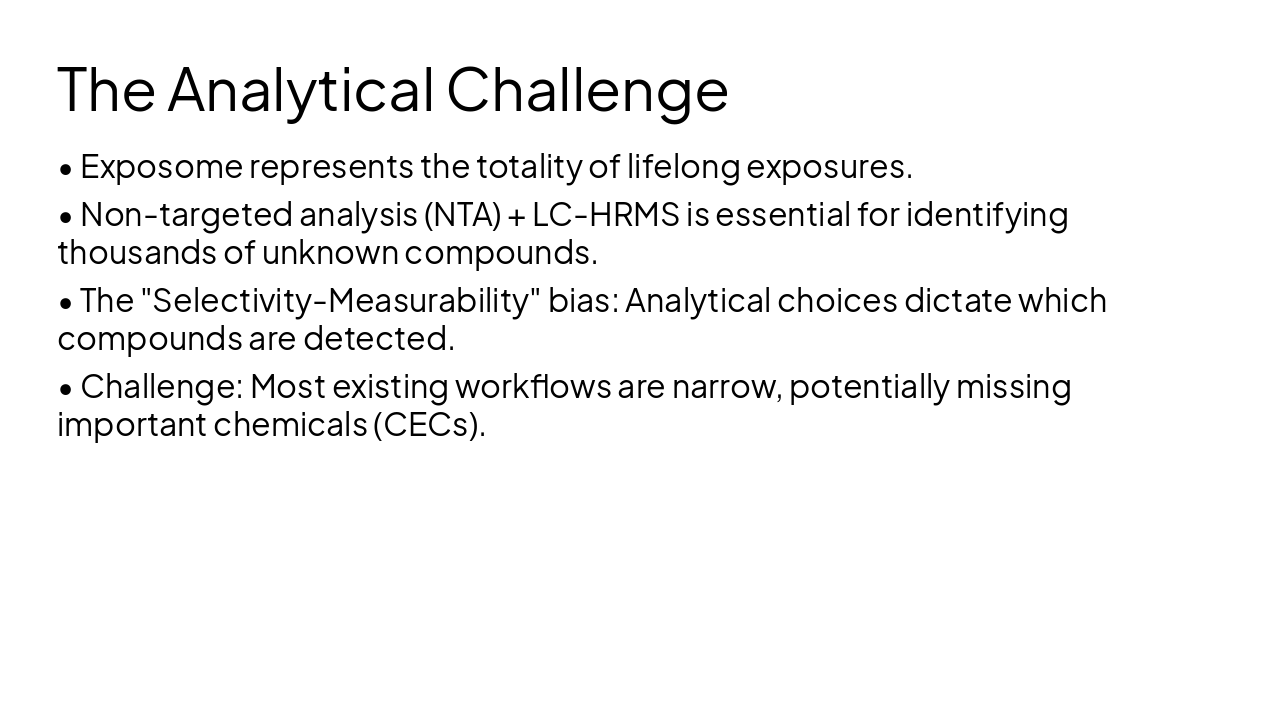
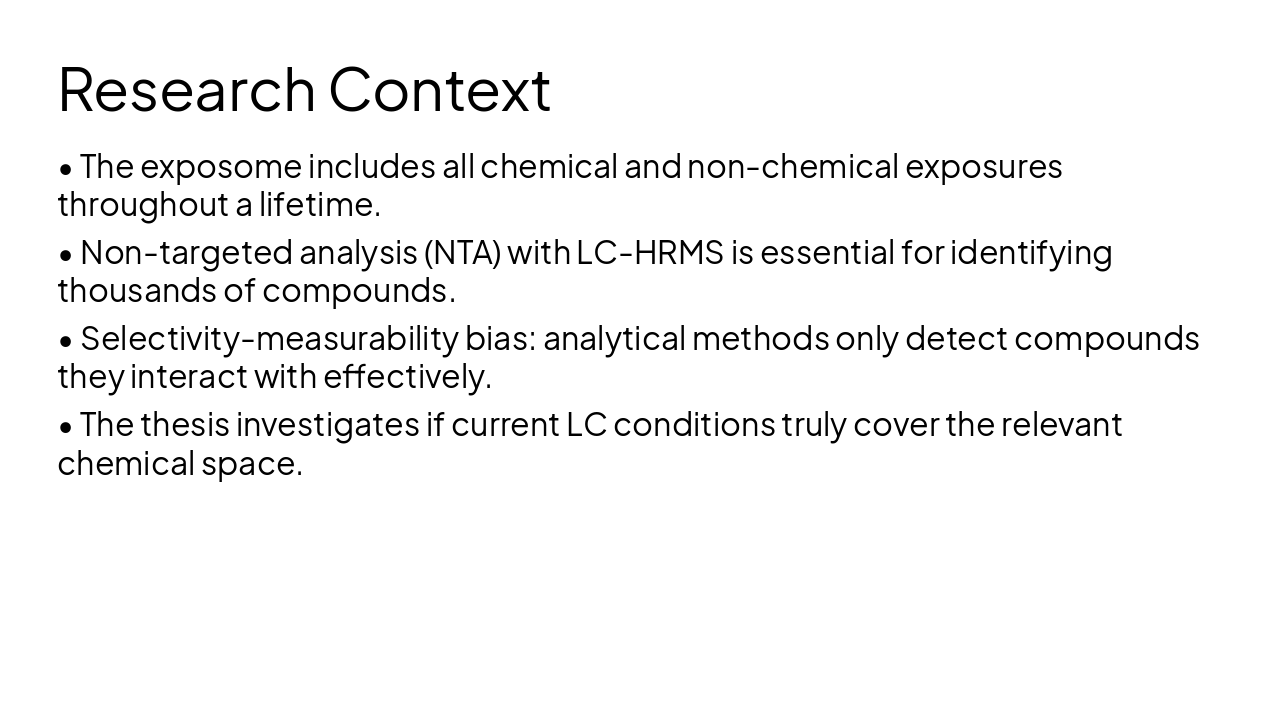
Chemical space, non-targeted analysis, and the selectivity-measurability bias
---
Photo by Nastuh Abootalebi on Unsplash

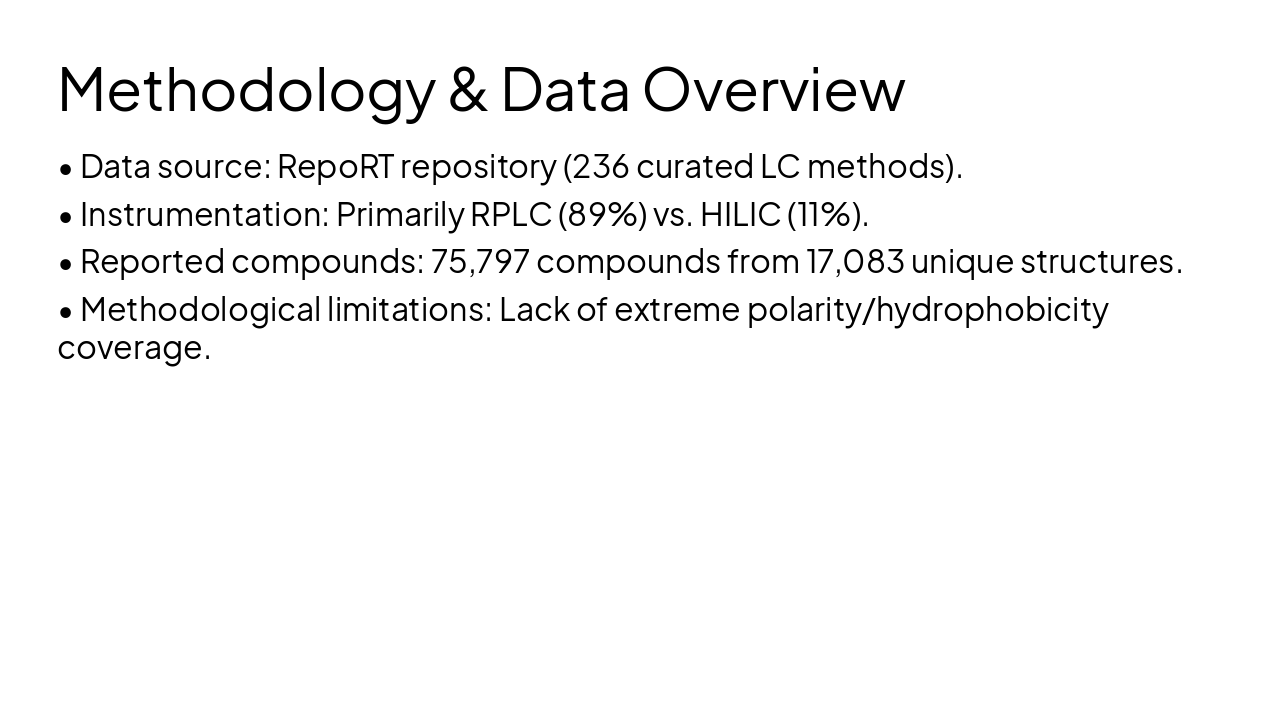
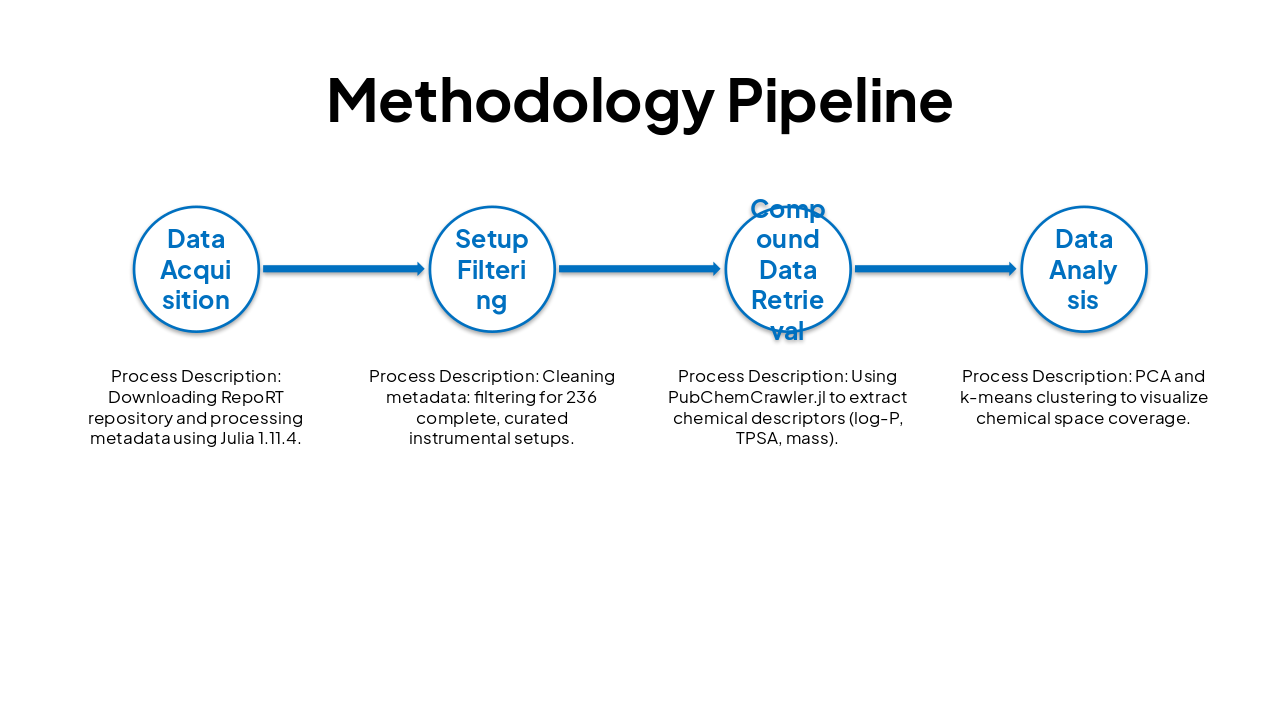
| Phase | Process Description |
|---|---|
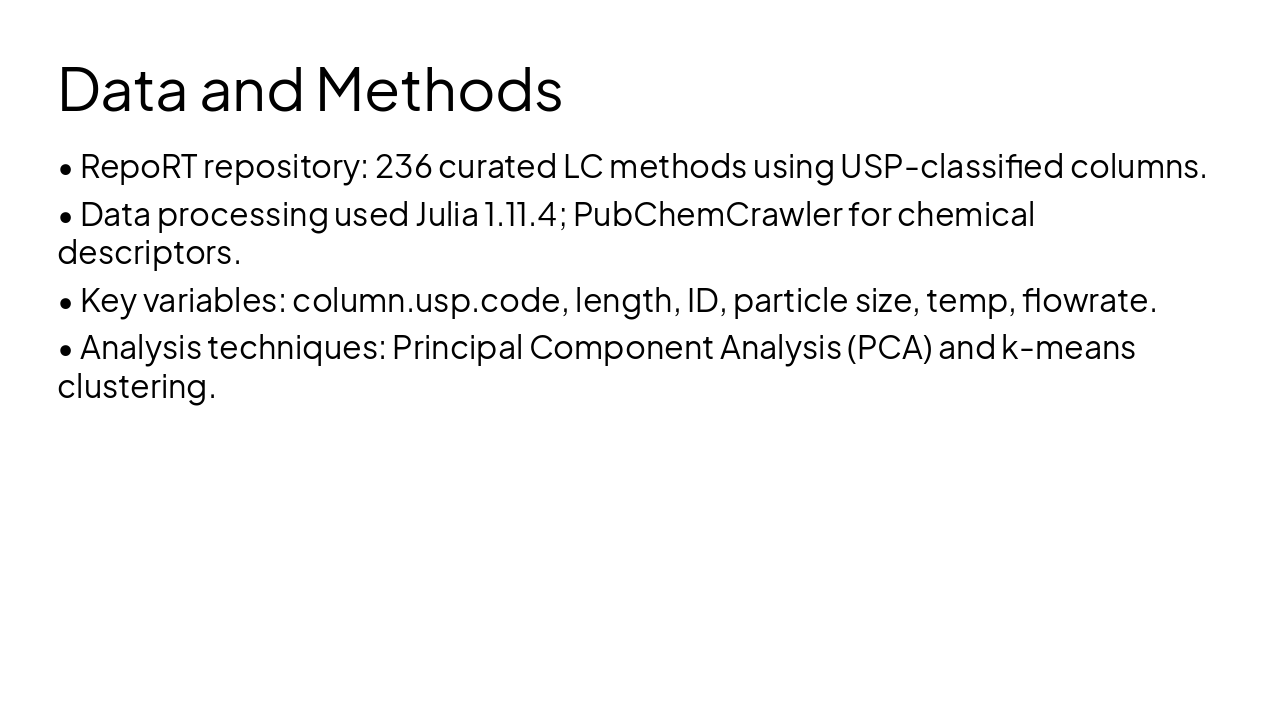
| Data Acquisition | Downloading RepoRT repository and processing metadata using Julia 1.11.4. |
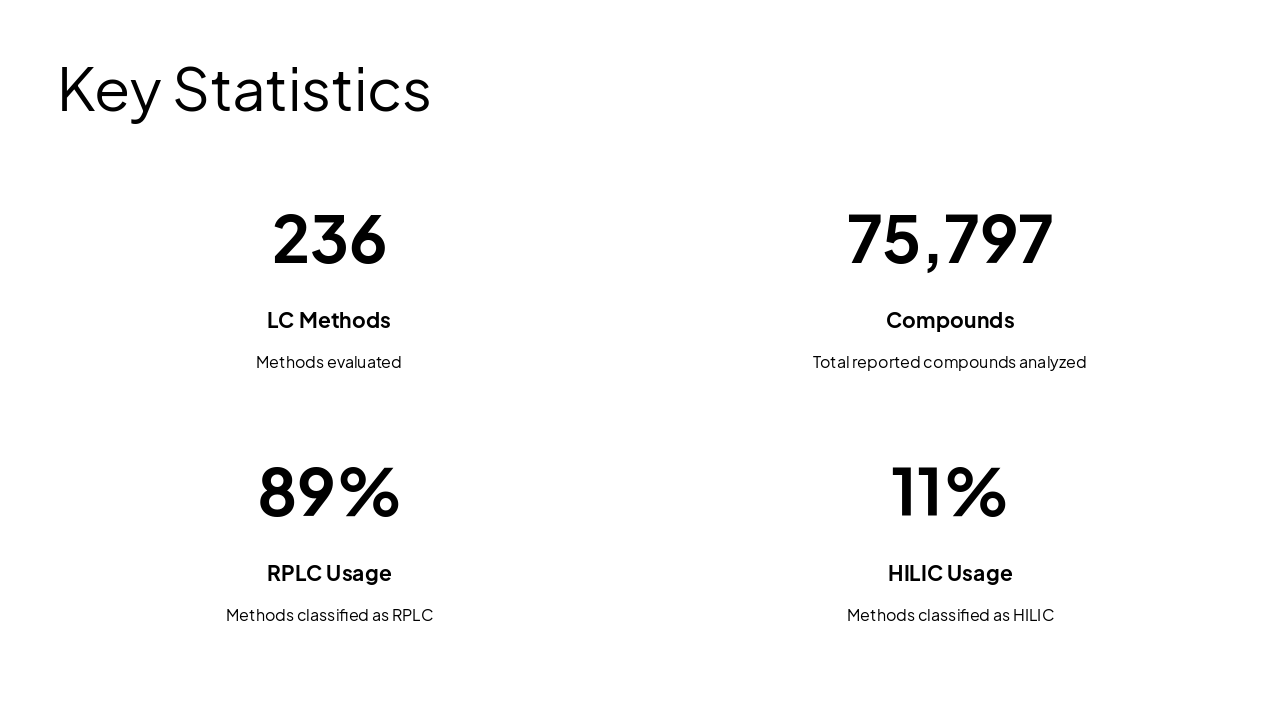
| Setup Filtering | Cleaning metadata: filtering for 236 complete, curated instrumental setups. |
| Compound Data Retrieval | Using PubChemCrawler.jl to extract chemical descriptors (log-P, TPSA, mass). |
| Data Analysis | PCA and k-means clustering to visualize chemical space coverage. |
2
Leveraging the RepoRT repository for data-driven assessment
---
Photo by Tom Parkes on Unsplash
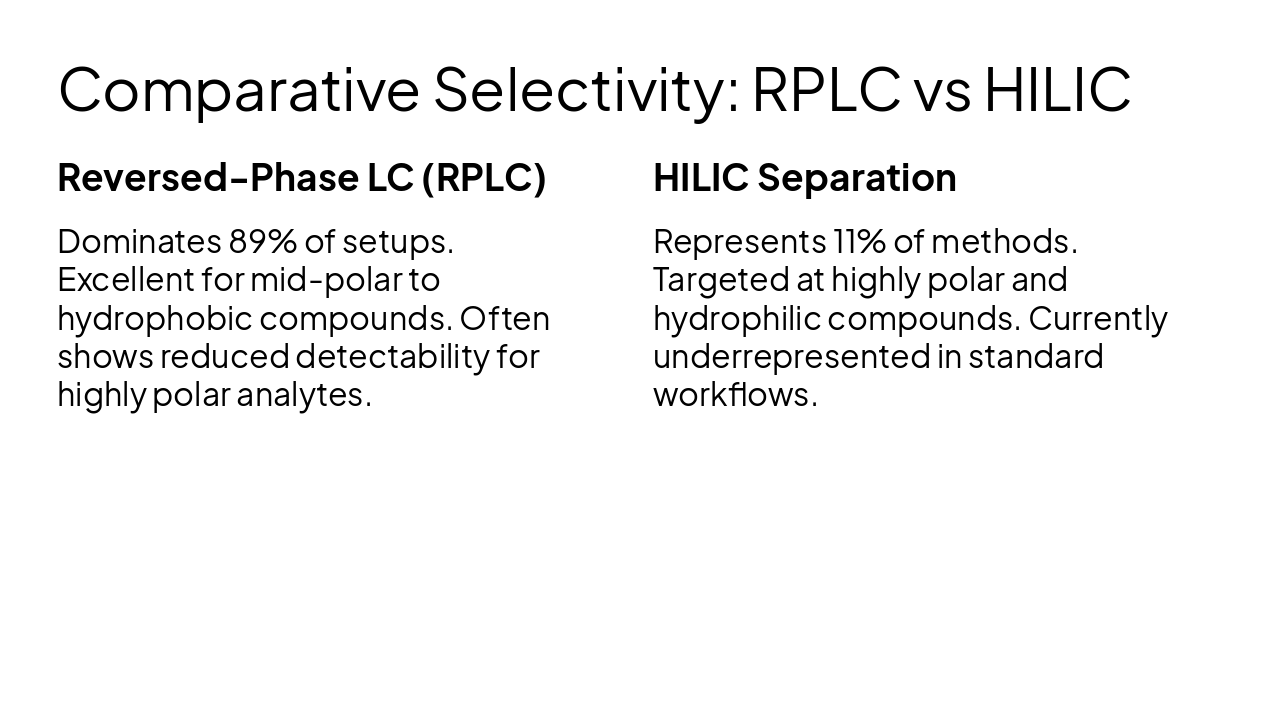
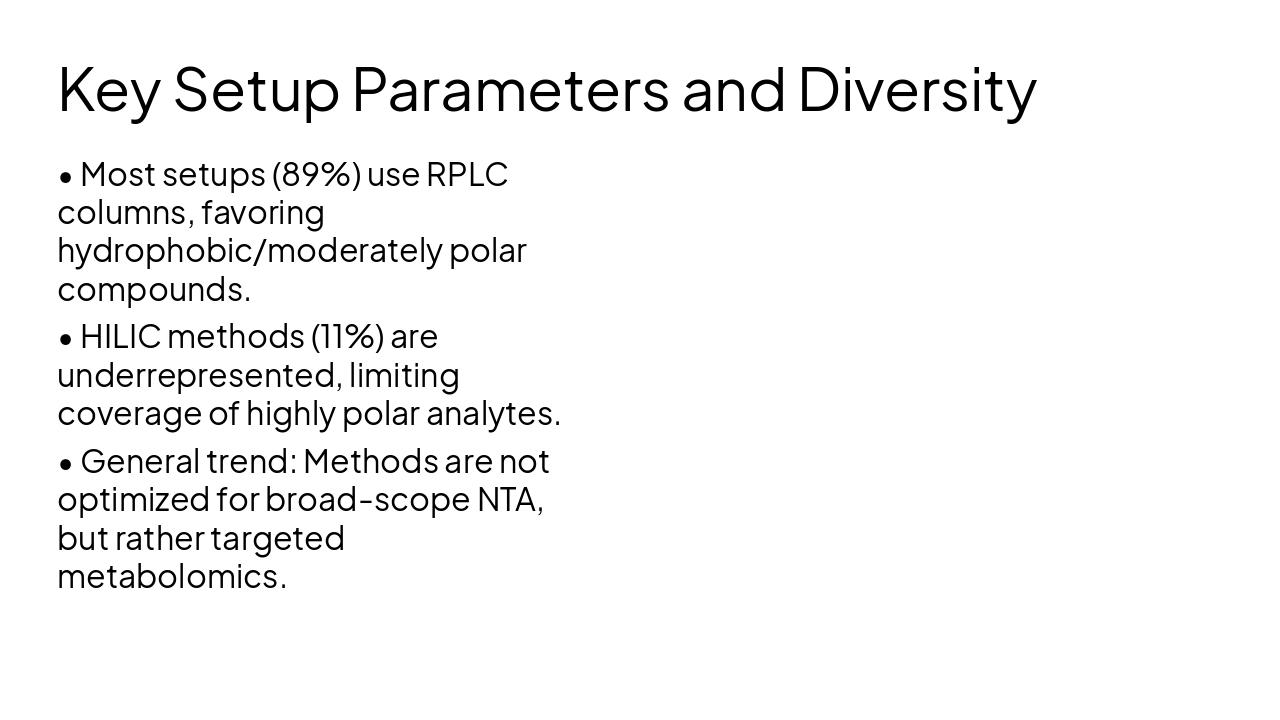
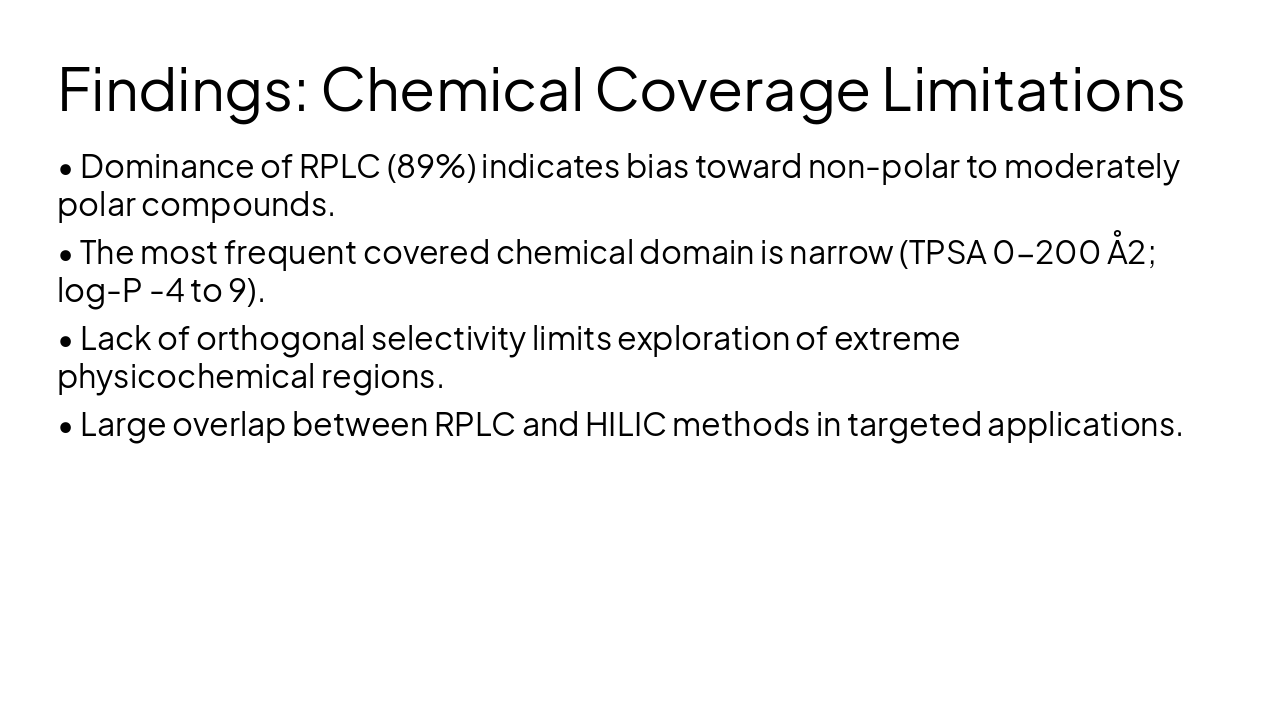
Reversed-Phase LC (RPLC) Dominates 89% of setups. Excellent for mid-polar to hydrophobic compounds. Often shows reduced detectability for highly polar analytes.
HILIC Separation Represents 11% of methods. Targeted at highly polar and hydrophilic compounds. Currently underrepresented in standard workflows.
3
What does the data reveal about LC performance?
---
Photo by Tom Parkes on Unsplash
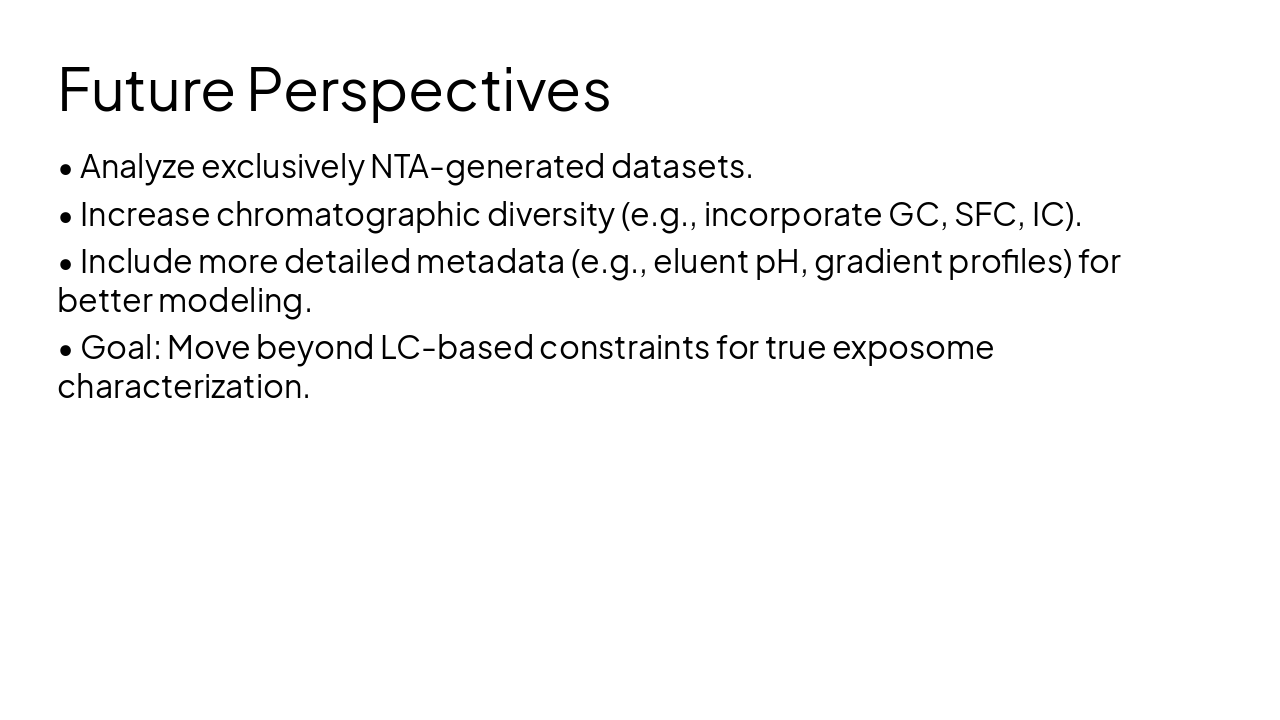
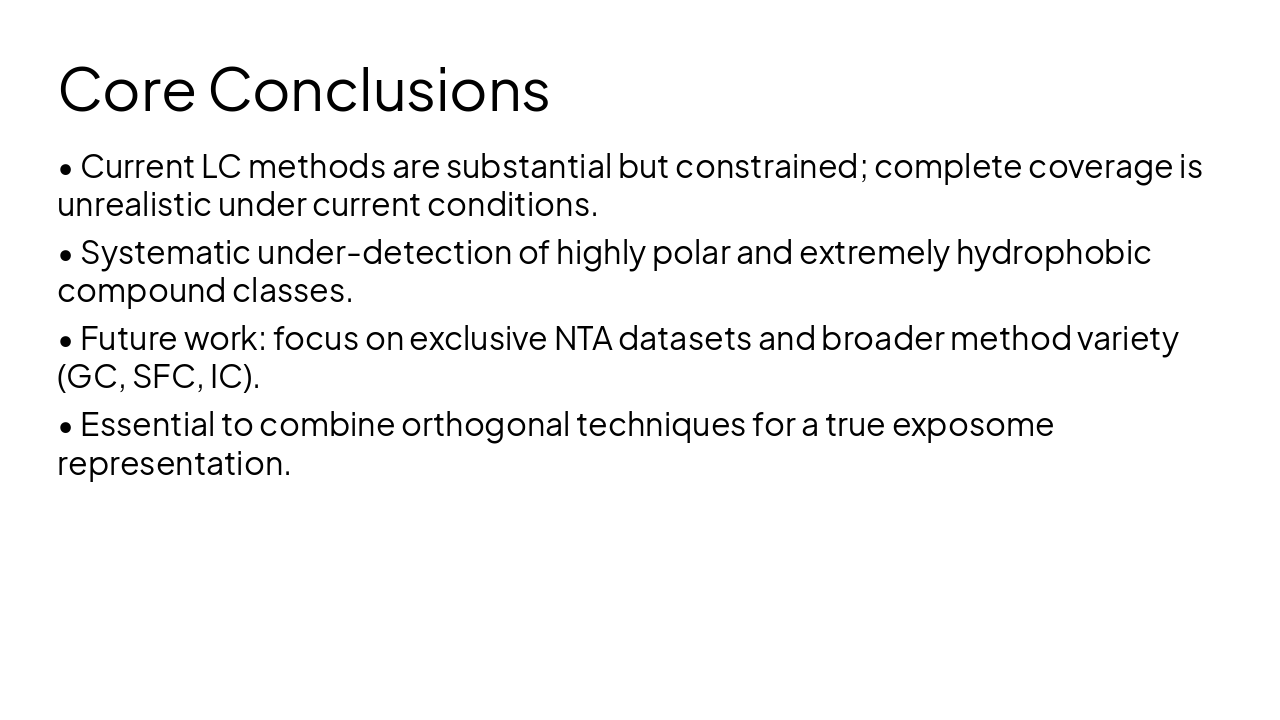
Thesis Conclusion: Need for wider scope strategies in NTA
Thank you for your attention. Questions?
---
Photo by Nastuh Abootalebi on Unsplash
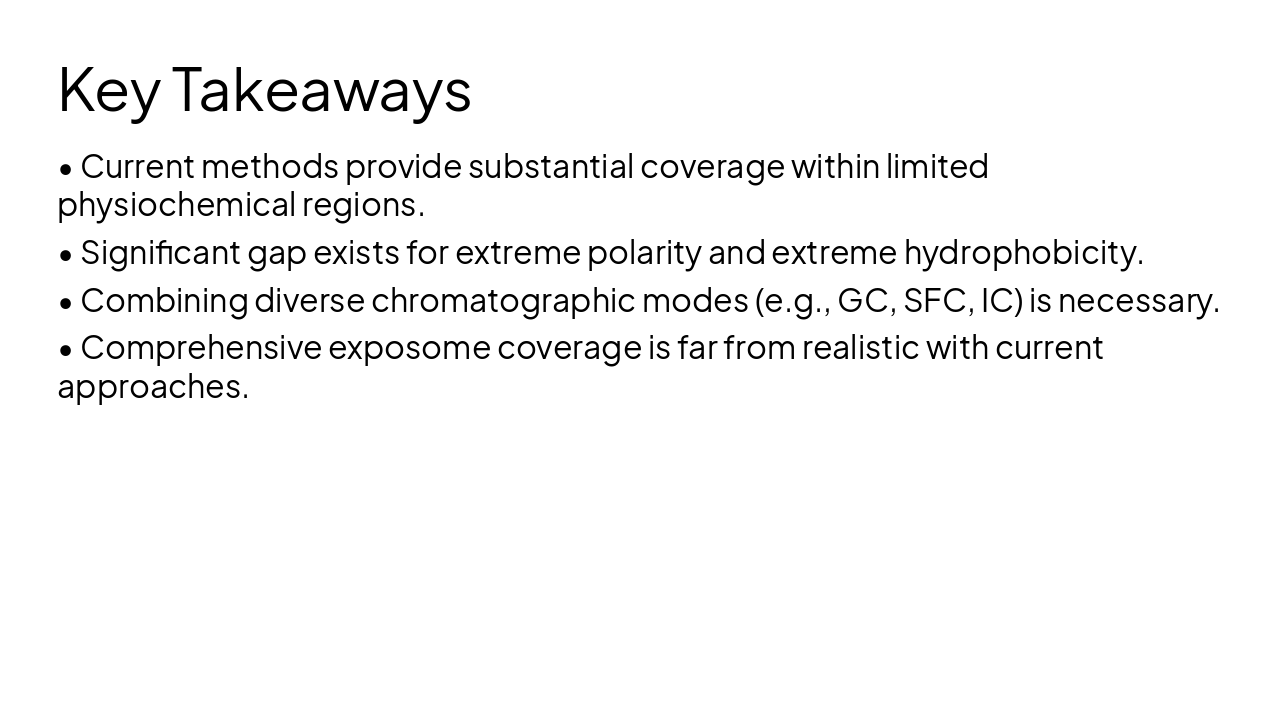
Complete chemical space coverage is not currently realistic with existing methods.
Advancing toward comprehensive exposome monitoring requires more than current LC workflows.
Conclusions & Perspectives
The journey toward comprehensive chemical space monitoring continues.
---
Photo by Nastuh Abootalebi on Unsplash

Explore thousands of AI-generated presentations for inspiration
Generate professional presentations in seconds with Karaf's AI. Customize this presentation or start from scratch.