Mastering 4-Quadrant Coordinate Grids

Generated from prompt:

Create a slide deck that introduces students to reading and plotting points on a four-quadrant coordinate grid. The presentation should explain what a coordinate grid is, describe the four quadrants, define x- and y-axes, and show how to plot points with positive and negative coordinates. Include visuals, example problems, and practice questions for the students.

Intro slide deck teaches students coordinate grids, quadrants, axes, and plotting positive/negative points with visuals, examples, and practice questions. (128 chars)

January 21, 20268 slides
Slide 1 of 8

Slide 1 - Introduction to Coordinate Grids

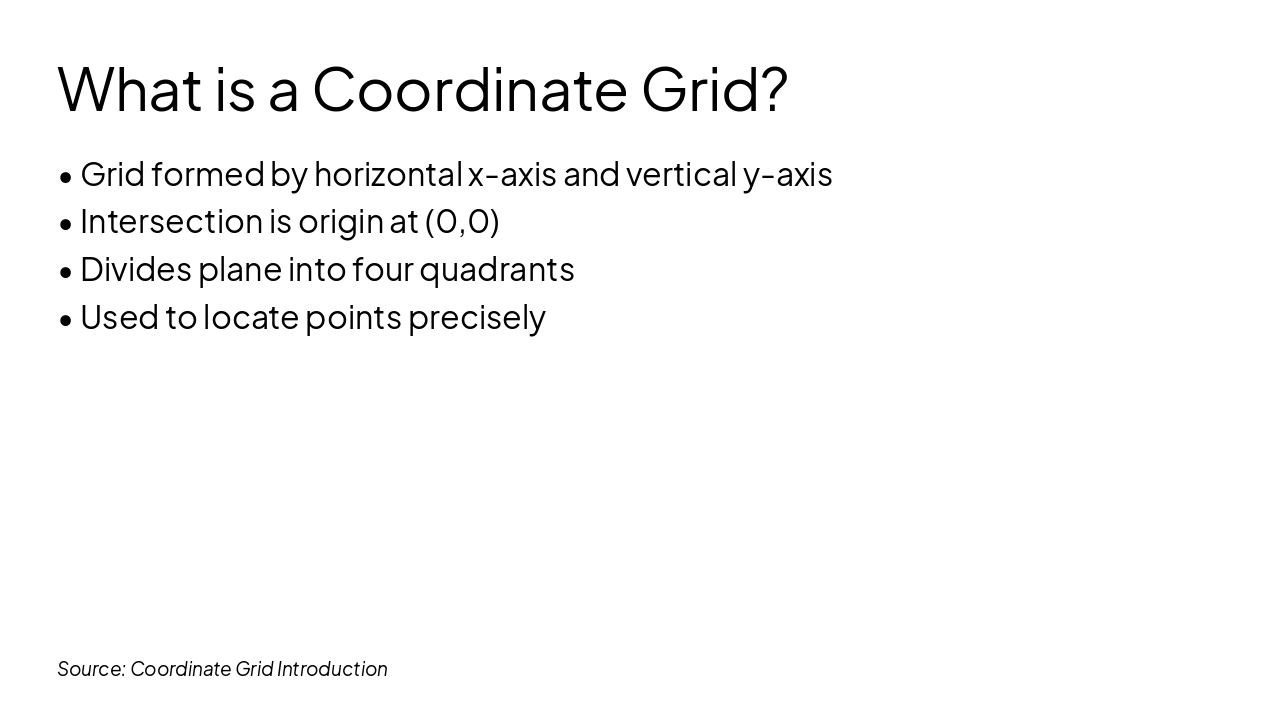
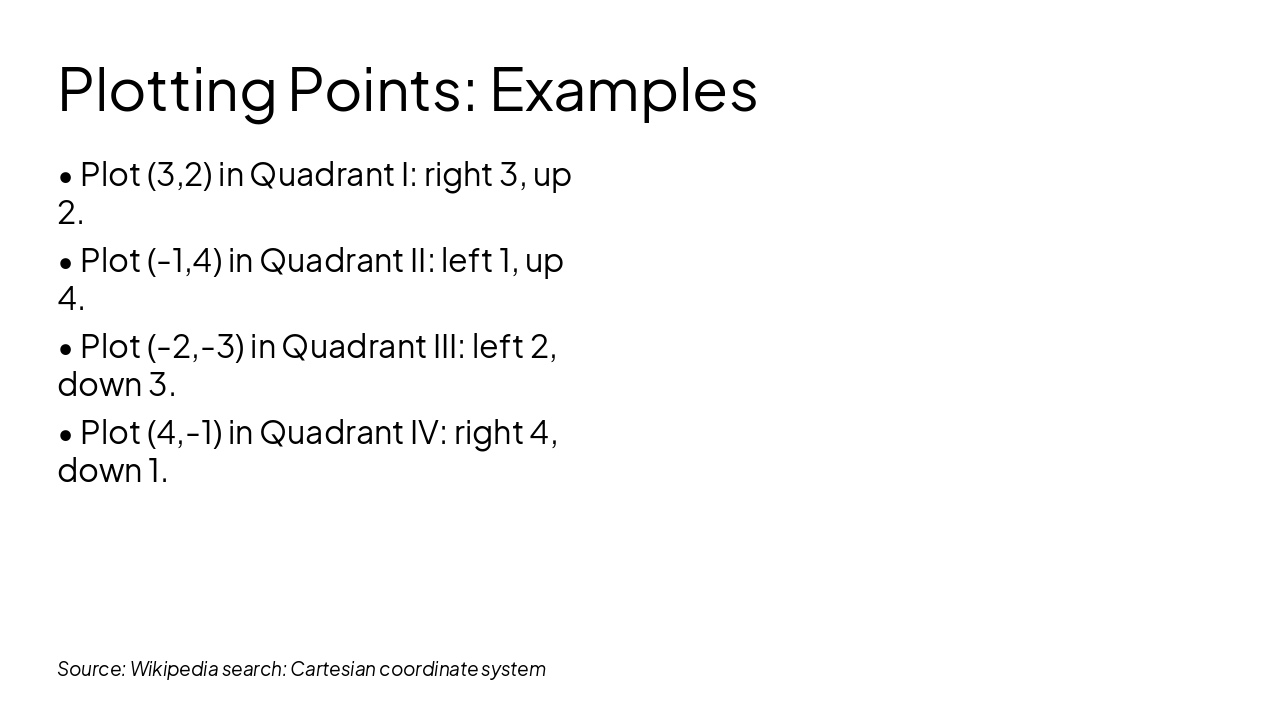
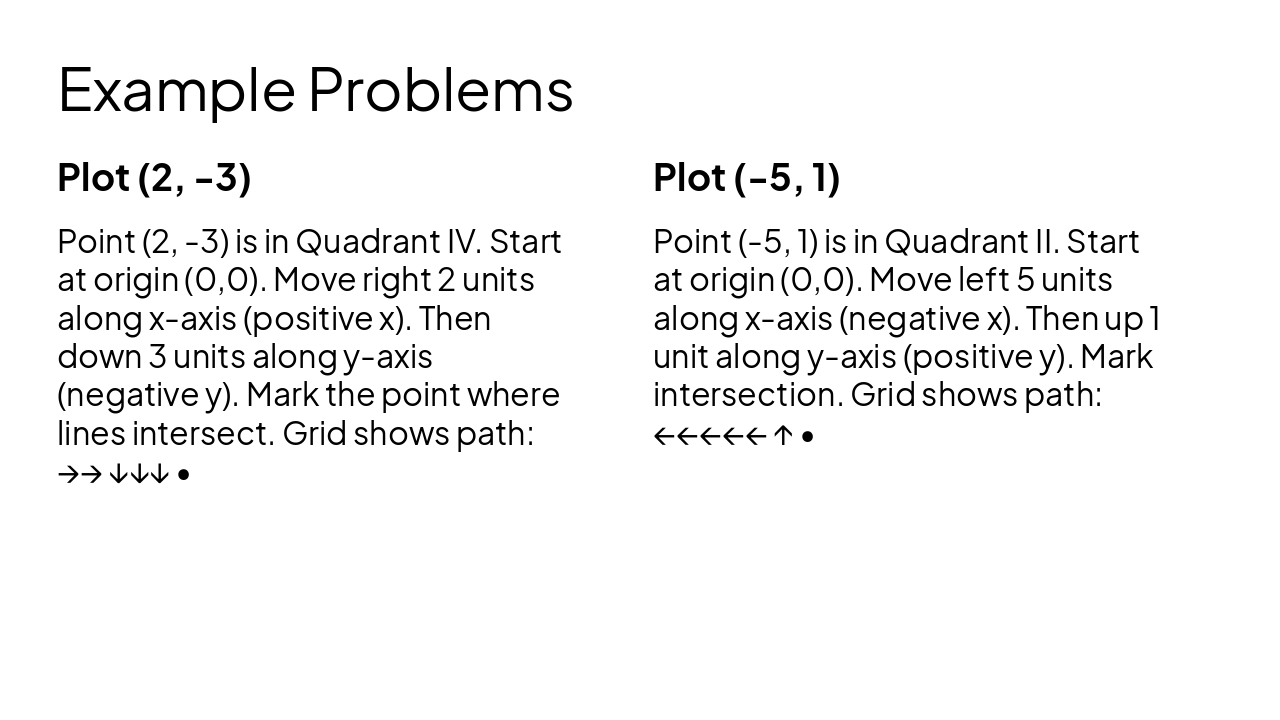
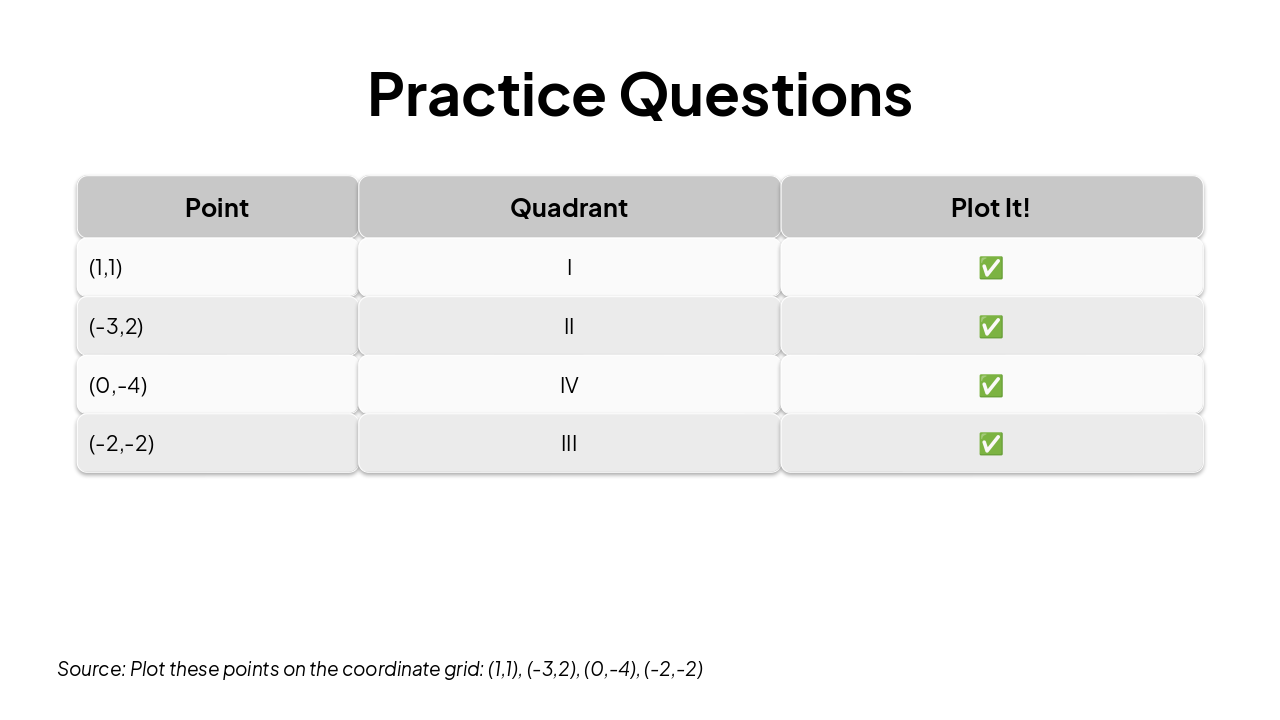
This title slide introduces the topic of "Introduction to Coordinate Grids." Its subtitle, "Plot Points Like Pros in Four Quadrants," highlights professional plotting techniques across the four quadrants of the grid.

Introduction to Coordinate Grids

Plot Points Like Pros in Four Quadrants

Speaker Notes
Welcome students and introduce the topic of plotting points on four-quadrant grids.
Slide 1 - Introduction to Coordinate Grids
Slide 2 of 8

Slide 2 - What is a Coordinate Grid?

A coordinate grid is formed by a horizontal x-axis and a vertical y-axis that intersect at the origin (0,0), dividing the plane into four quadrants. It is used to locate points precisely.

What is a Coordinate Grid?

  • Grid formed by horizontal x-axis and vertical y-axis
  • Intersection is origin at (0,0)
  • Divides plane into four quadrants
  • Used to locate points precisely

Source: Coordinate Grid Introduction

Slide 2 - What is a Coordinate Grid?
Slide 3 of 8

Slide 3 - The Four Quadrants

The slide titled "The Four Quadrants" illustrates the standard coordinate plane divisions. Quadrant I is in the top-right (+, +), Quadrant II in the top-left (-, +), Quadrant III in the bottom-left (-, -), and Quadrant IV in the bottom-right (+, -).

The Four Quadrants

  • Quadrant I: (+, +) top-right
  • Quadrant II: (-, +) top-left
  • Quadrant III: (-, -) bottom-left
  • Quadrant IV: (+, -) bottom-right

Source: Wikipedia search: Cartesian coordinate system

Slide 3 - The Four Quadrants
Slide 4 of 8

Slide 4 - Understanding the Axes

The slide explains the X-axis as horizontal (positive to the right, negative to the left) and the Y-axis as vertical (positive up, negative down). It also describes ordered pairs in the format (x, y), with x first followed by y.

Understanding the Axes

  • X-axis: horizontal, positive right, negative left
  • Y-axis: vertical, positive up, negative down
  • Ordered pairs: (x, y) – x first, then y

Source: Coordinate Grid Introduction

Slide 4 - Understanding the Axes
Slide 5 of 8

Slide 5 - Plotting Points: Examples

This slide titled "Plotting Points: Examples" provides instructions for graphing four coordinate points on a plane. It covers (3,2) in Quadrant I (right 3, up 2), (-1,4) in Quadrant II (left 1, up 4), (-2,-3) in Quadrant III (left 2, down 3), and (4,-1) in Quadrant IV (right 4, down 1).

Plotting Points: Examples

  • Plot (3,2) in Quadrant I: right 3, up 2.
  • Plot (-1,4) in Quadrant II: left 1, up 4.
  • Plot (-2,-3) in Quadrant III: left 2, down 3.
  • Plot (4,-1) in Quadrant IV: right 4, down 1.

Source: Wikipedia search: Cartesian coordinate system

Slide 5 - Plotting Points: Examples
Slide 6 of 8

Slide 6 - Example Problems

This slide demonstrates plotting points on a coordinate grid with two examples. The left side explains plotting (2, -3) in Quadrant IV by moving right 2 units and down 3 units from the origin, while the right side covers (-5, 1) in Quadrant II by moving left 5 units and up 1 unit.

Example Problems

Plot (2, -3)Plot (-5, 1)
Point (2, -3) is in Quadrant IV. Start at origin (0,0). Move right 2 units along x-axis (positive x). Then down 3 units along y-axis (negative y). Mark the point where lines intersect. Grid shows path: →→ ↓↓↓ •Point (-5, 1) is in Quadrant II. Start at origin (0,0). Move left 5 units along x-axis (negative x). Then up 1 unit along y-axis (positive y). Mark intersection. Grid shows path: ←←←←← ↑ •
Slide 6 - Example Problems
Slide 7 of 8

Slide 7 - Practice Questions

The slide titled "Practice Questions" features a table listing four coordinate points, their corresponding quadrants (I, II, IV, III), and a checkmark confirming correct plotting for each. It serves as a quick verification exercise for identifying and plotting points on the Cartesian plane.

Practice Questions

PointQuadrantPlot It!
(1,1)I
(-3,2)II
(0,-4)IV
(-2,-2)III

Source: Plot these points on the coordinate grid: (1,1), (-3,2), (0,-4), (-2,-2)

Slide 7 - Practice Questions
Slide 8 of 8

Slide 8 - You're a Plotting Pro! 🎯

The slide celebrates achieving "Grid Guru" status and becoming a plotting pro, encouraging continued practice for perfection. It invites questions and reinforces mastering coordinates with a call to keep plotting.

You're a Plotting Pro! 🎯

Grid Guru Achieved! 🎯

Practice plots to plot perfection.

Questions? Ask away!

Mastered coordinates – keep plotting!

Source: Coordinate Grid Mastery

Speaker Notes
Recap key learnings, encourage practice, invite questions.
Slide 8 - You're a Plotting Pro! 🎯

Discover More Presentations

Explore thousands of AI-generated presentations for inspiration

Browse Presentations
Powered by AI

Create Your Own Presentation

Generate professional presentations in seconds with Karaf's AI. Customize this presentation or start from scratch.

Create New Presentation

Powered by Karaf.ai — AI-Powered Presentation Generator