Slide 1 of 14
Slide 1 - Aircraft Design Analysis Project
Aircraft Design Analysis Project
Aircraft Design Process: From Constraints to Mission Analysis
---
Photo by Navy Medicine on Unsplash
Generated from prompt:
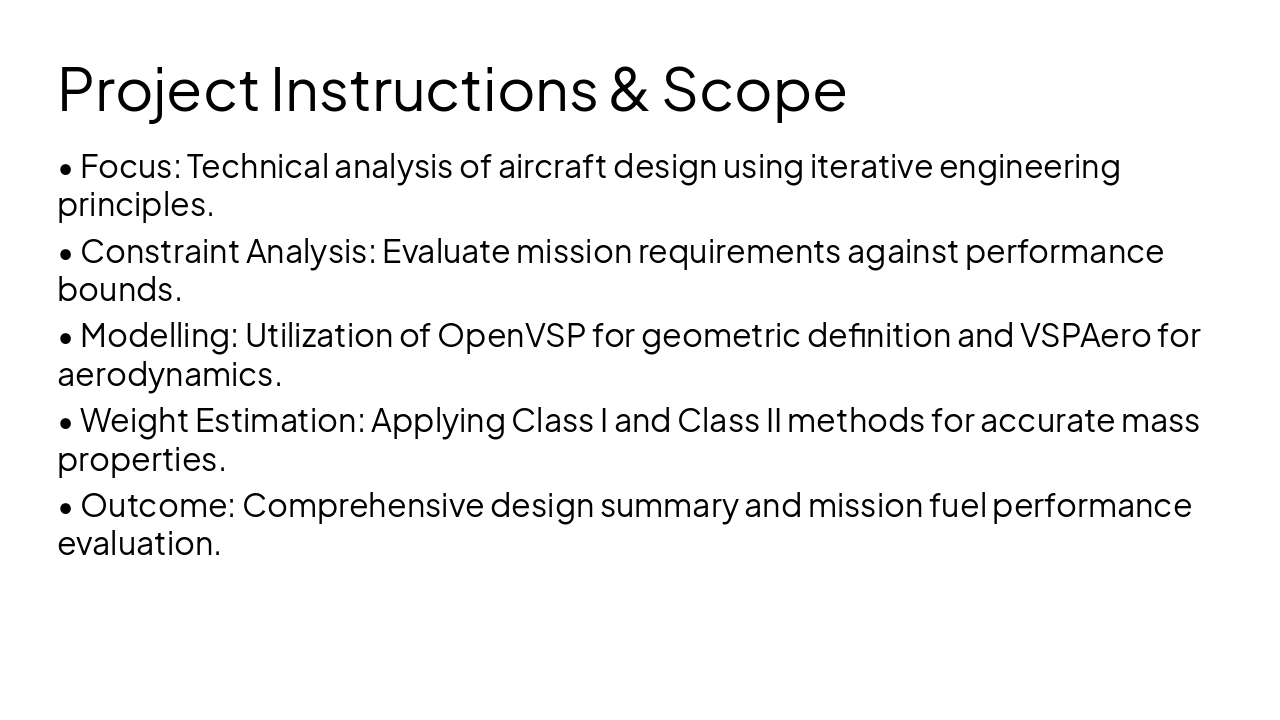
Redesign and improve the visual quality of this presentation while keeping ALL original content unchanged. Apply a modern, clean aerospace-themed style with consistent typography, spacing, and hierarchy. Slides to include (same content, improved design): - Cover slide with placeholders for student info and image - Instructions slide (clean layout, callouts, remove clutter) - Section divider slides for Sections 1–3 - Section 1 (3 slides): constraint analysis, TLR interpretation, Class I weight estimation, constraint diagram explanation - Section 2 (3 slides): OpenVSP modelling steps, three-view images, VSPAero results and plots - Section 3 (4 slides): Class II weight estimation, mission fuel analysis, iteration visuals, summary - GenAI declaration slide Design requirements: - Use consistent color palette (dark blue, light blue, white, subtle orange accent) - Improve readability (larger headings, bullet hierarchy, spacing) - Convert dense paragraphs into structured bullets - Add visual placeholders for graphs, diagrams, and screenshots - Use icons for sections (analysis, modelling, results) - Align all elements and use consistent margins - Remove instructional clutter visually but keep text content - Ensure academic/professional look suitable for university submission Do not remove or rewrite any technical content—only improve layout, formatting, and clarity.
This presentation details the iterative aircraft design process, covering constraint analysis, initial sizing, OpenVSP geometry modeling, VSPAero aerodynamics, Class I/II weight estimation, and mission fuel performance verification to meet top-level-
Aircraft Design Analysis Project
Aircraft Design Process: From Constraints to Mission Analysis
---
Photo by Navy Medicine on Unsplash
1
Foundations for performance and configuration sizing
---
Photo by Logan Voss on Unsplash
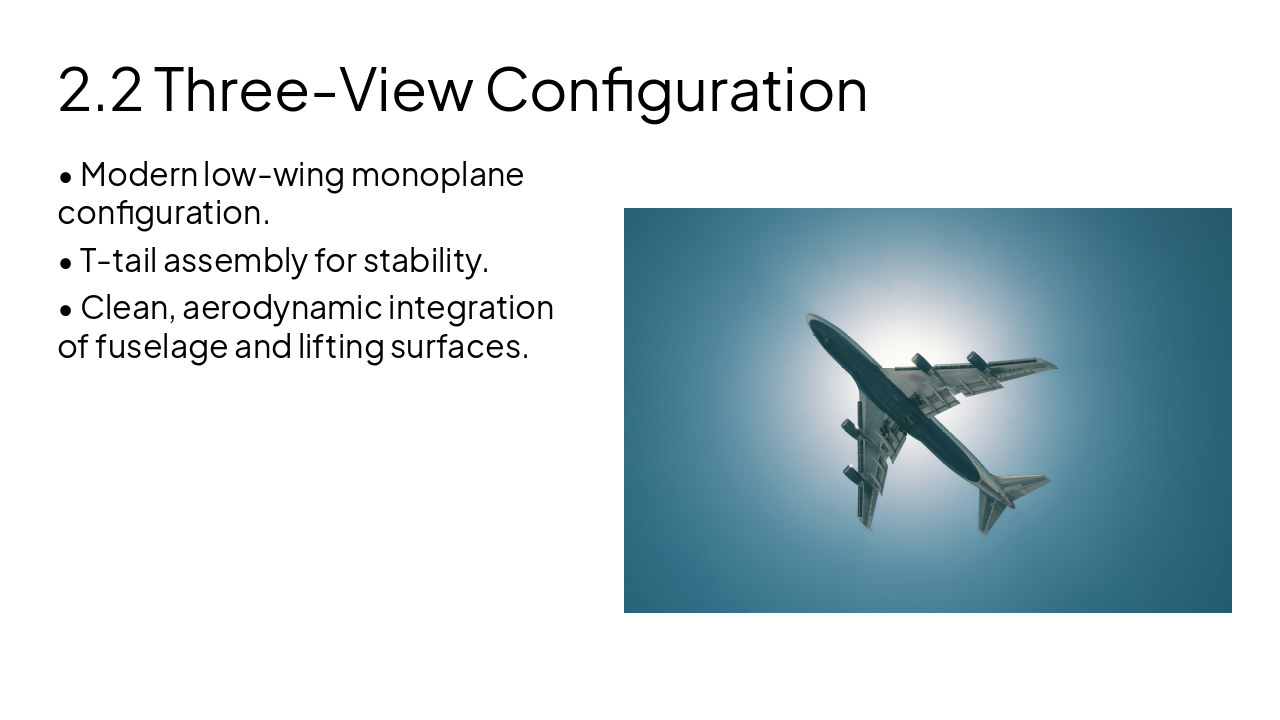
2
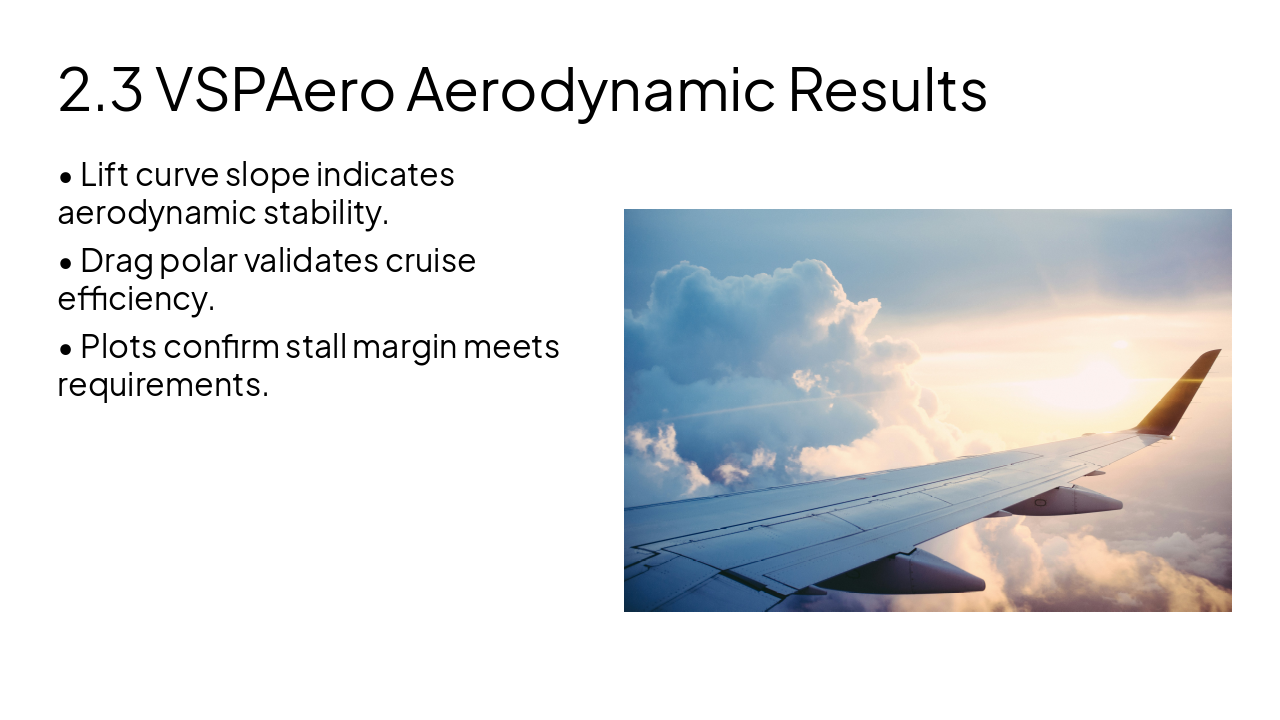
OpenVSP configuration and VSPAero validation
---
Photo by Codioful (Formerly Gradienta) on Unsplash
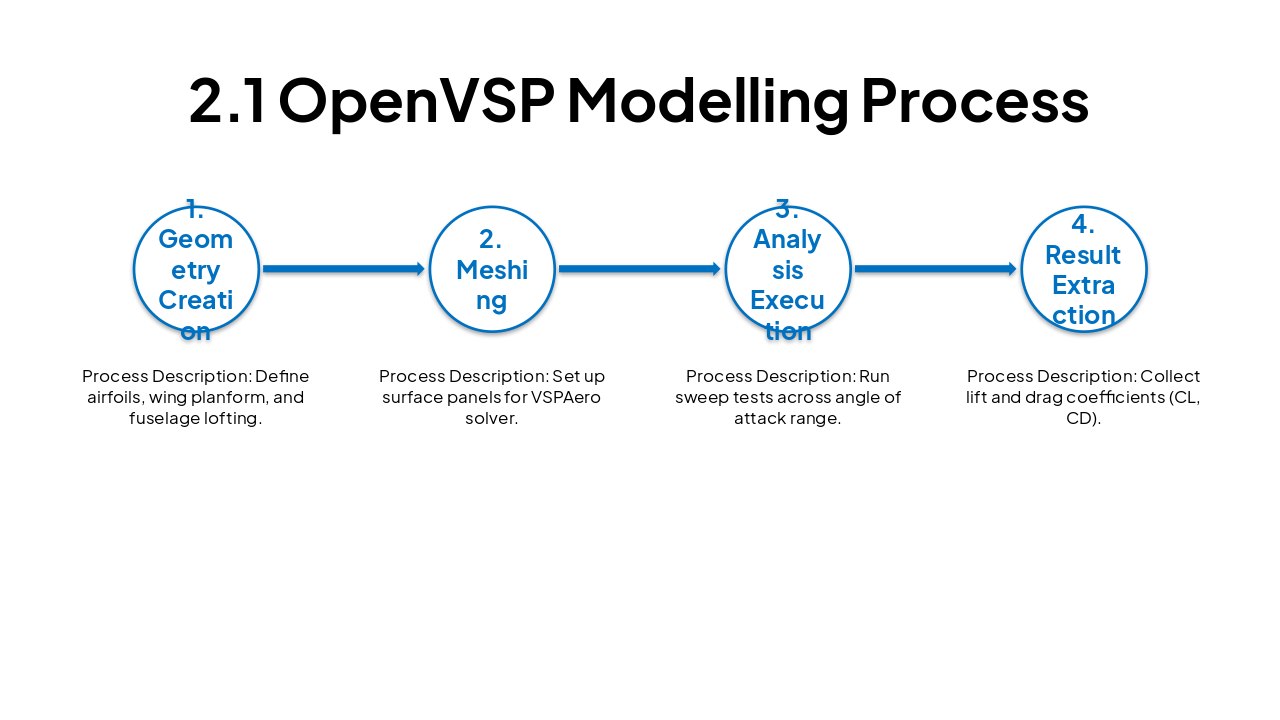
| Step | Process Description |
|---|---|
| 1. Geometry Creation | Define airfoils, wing planform, and fuselage lofting. |
| 2. Meshing | Set up surface panels for VSPAero solver. |
| 3. Analysis Execution | Run sweep tests across angle of attack range. |
| 4. Result Extraction | Collect lift and drag coefficients (CL, CD). |
---
Photo by Spencer Imbrock on Unsplash
---
Photo by Ross Parmly on Unsplash
3
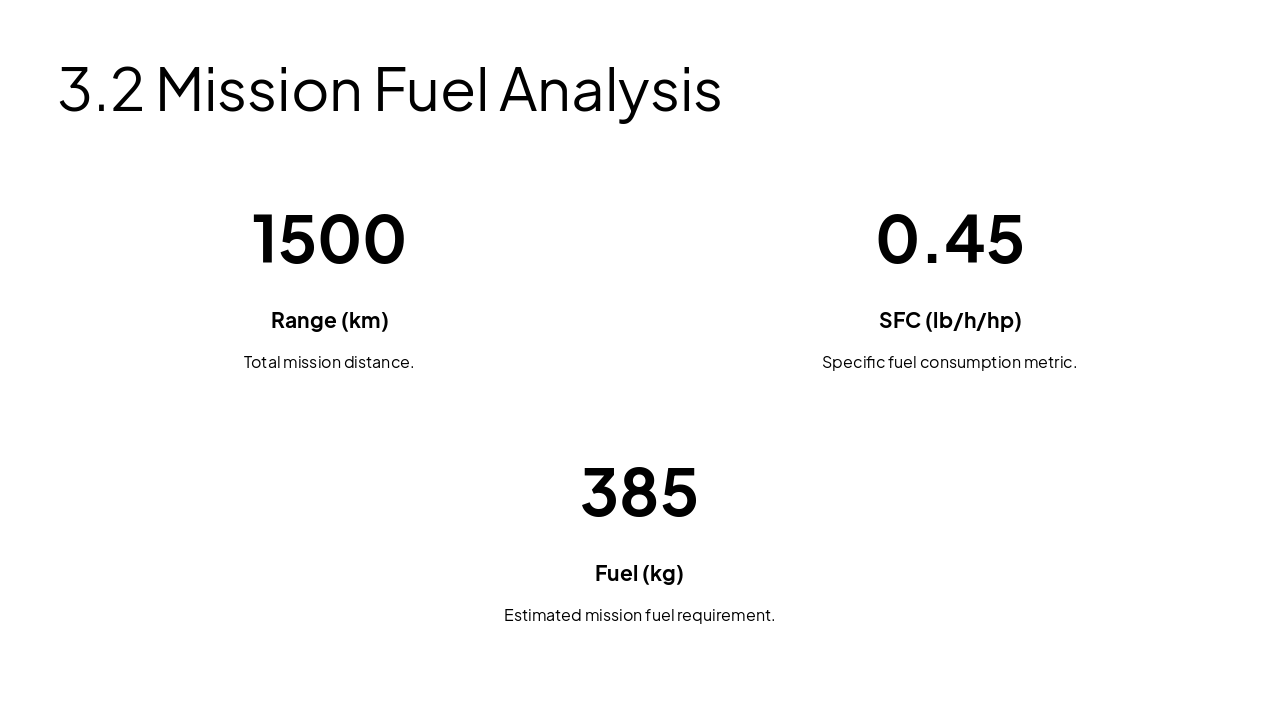
Final iteration and fuel consumption verification
---
Photo by Logan Voss on Unsplash
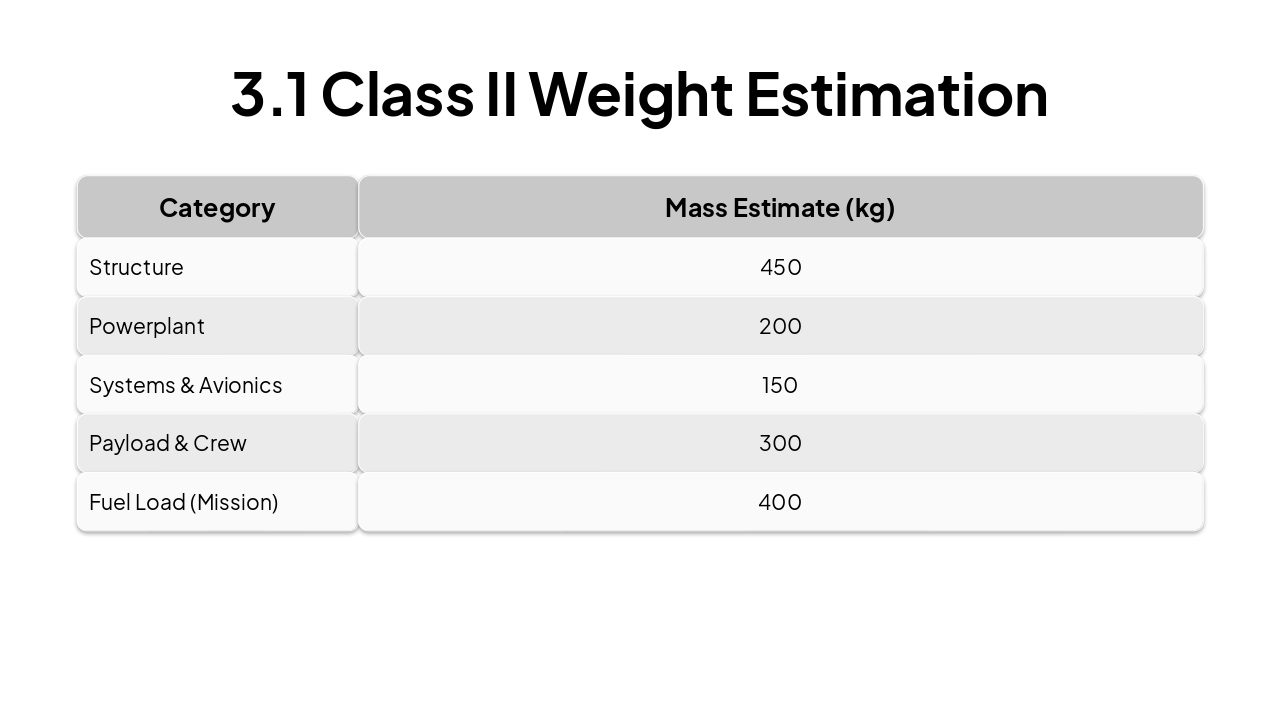
| Category | Mass Estimate (kg) |
|---|---|
| Structure | 450 |
| Powerplant | 200 |
| Systems & Avionics | 150 |
| Payload & Crew | 300 |
| Fuel Load (Mission) | 400 |
---
Photo by Kelly Sikkema on Unsplash
Explore thousands of AI-generated presentations for inspiration
Generate professional presentations in seconds with Karaf's AI. Customize this presentation or start from scratch.