Slide 1 of 12
Slide 1 - Local Structure Presentation
Local Structure Strategy
Strengthening Regional Operations and Strategic Local Sourcing
---
Photo by Nastuh Abootalebi on Unsplash
Generated from prompt:
Create a visually appealing, modern PowerPoint (10–12 slides) based on a 3-page document titled 'Local Structure'. Use clean corporate design, icons, and UK map visuals. Slides: 1. Title Slide – Local Structure 2. Overview of Team Structure – highlight Head of (James Lamont) and team hierarchy 3. Organizational Chart – visually redesigned (clean hierarchy) 4. Regional Buying Managers – Scotland (Packaged & Fresh), Wales, England 5. Supporting Roles – Relationship Manager, Technical Manager, Ranging (TBS) 6. Scale of Operation – 1700 SKUs, 262 suppliers, 107 JB areas (use infographic) 7. Why Local Sourcing Matters – key stats (65%, 76%, 53%) 8. Customer Expectations – 80% expect local products 9. Strategic Pillars – Quality Growth & Commercial Excellence 10. Objectives Overview – Improve perception, remove complexity, improve proposition 11. Key Targets – include bullets (16.5% convenience, 20% overlay reduction, 87.5% supplier view, etc.) 12. Strategy & Growth – Deliver 2% B4L, G&G growth, media plan Design notes: - Use icons, minimal text, strong headings - Include UK map visual for regional context - Use color-coded sections - Convert dense text into visuals (charts, icons, diagrams) - Keep slides clean and executive-friendly Output both PPTX and PDF.
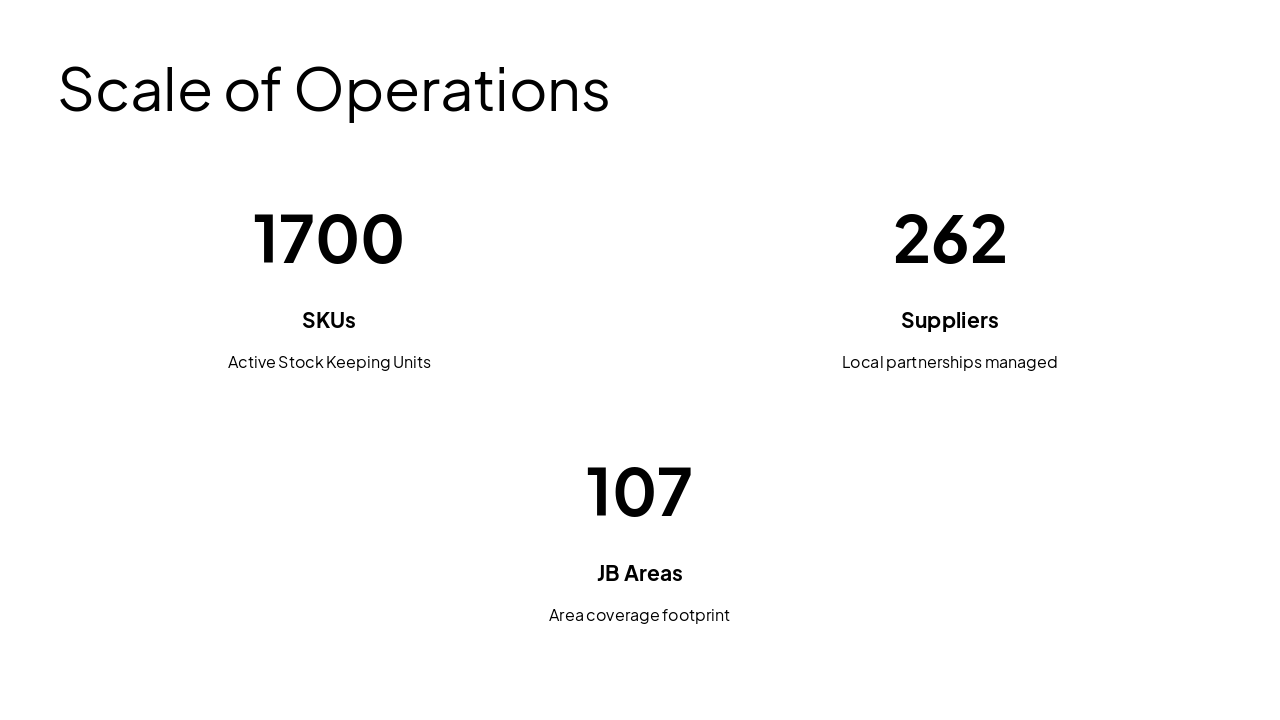
Overview of the Local Structure team organization, regional buying hierarchy, support roles, operational scale with 1700 SKUs and 262 suppliers, benefits of local sourcing, customer expectations, strategic pillars of Quality Growth and Commercial-Ex,
Local Structure Strategy
Strengthening Regional Operations and Strategic Local Sourcing
---
Photo by Nastuh Abootalebi on Unsplash
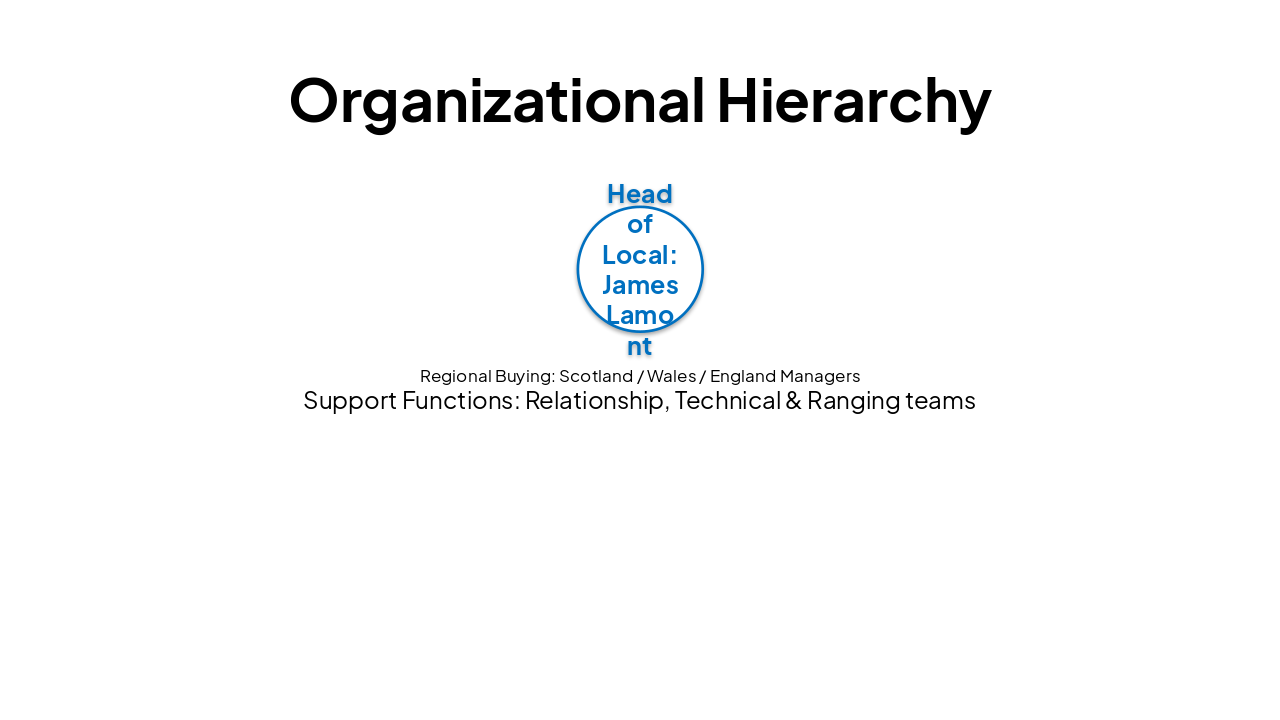
| Leadership | Regional Buying | Support Functions |
|---|---|---|
| Head of Local: James Lamont | Scotland / Wales / England Managers | Relationship, Technical & Ranging teams |
---
Photo by Paul Marlow on Unsplash
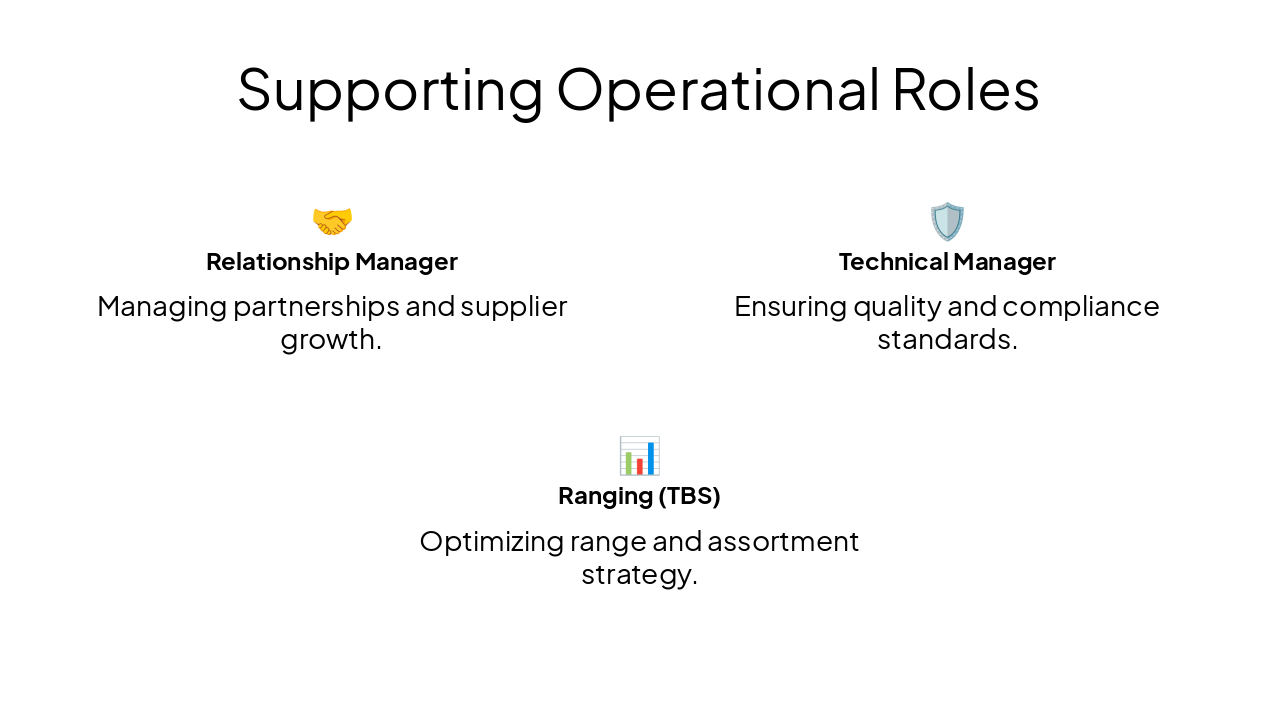
🤝 Relationship Manager Managing partnerships and supplier growth.
🛡️ Technical Manager Ensuring quality and compliance standards.
📊 Ranging (TBS) Optimizing range and assortment strategy.
Quality Growth Enhancing product standards and local reputation.
Commercial Excellence Driving efficiency and regional profitability.
Driving Future Strategy & Growth
Delivering 2% B4L, G&G growth, and comprehensive media activation.
---
Photo by Nastuh Abootalebi on Unsplash

Explore thousands of AI-generated presentations for inspiration
Generate professional presentations in seconds with Karaf's AI. Customize this presentation or start from scratch.