Slide 1 of 6
Slide 1 - QBR Financial Presentation
Quarterly Business Review: Financial Performance
Q1 Performance Analysis and Future Outlook
Generated from prompt:
Make QBR financial ppt slide 1 - The key financial indicators are: sales (quantity/value), gross profit, net profit, and adjusted net profit compared to the budget and the same period of the previous year By displaying large icons containing the cursor's information, rather than a table. slide 2 - export sales by region compare last year aNd budget slide 3 - local sales like export sale slide 4 - The plan set for the second quarter and how to achieve it
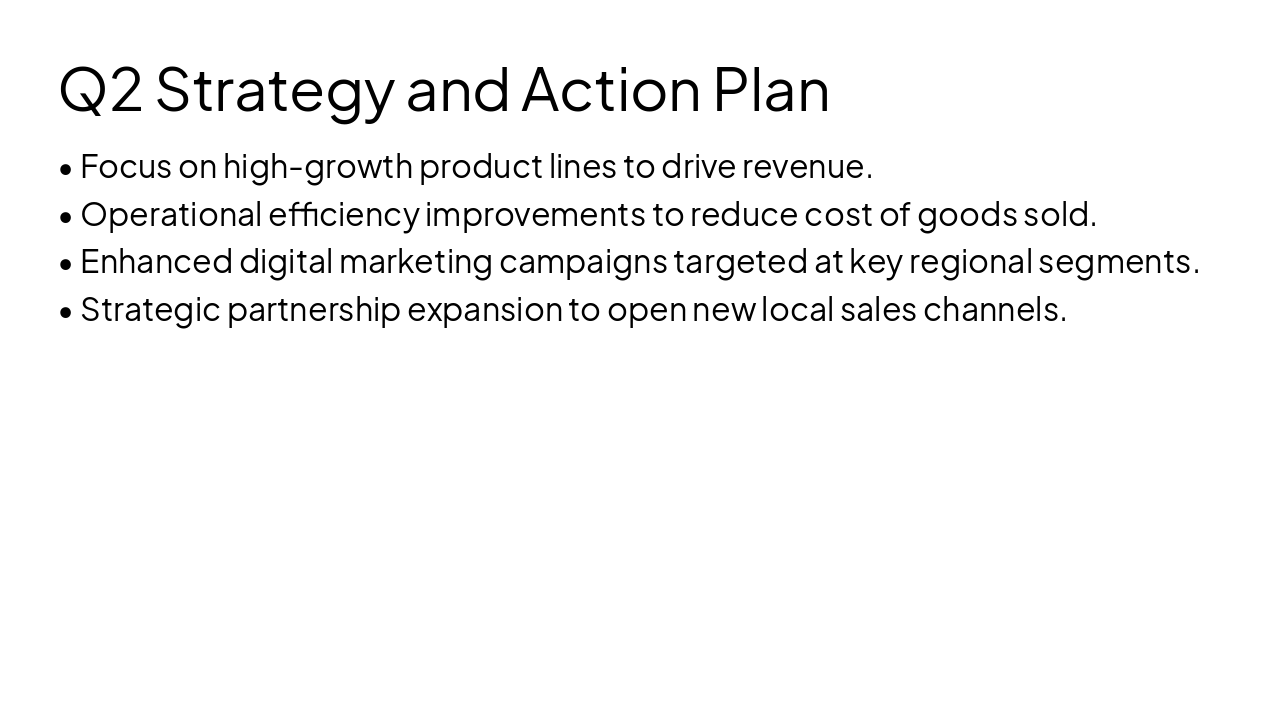
Quarterly Business Review analyzing Q1 financial results, including key indicators like sales, gross/net profit, regional export and local sales comparisons against budget and prior year. Concludes with Q2 strategy focusing on growth, efficiency, and
Quarterly Business Review: Financial Performance
Q1 Performance Analysis and Future Outlook
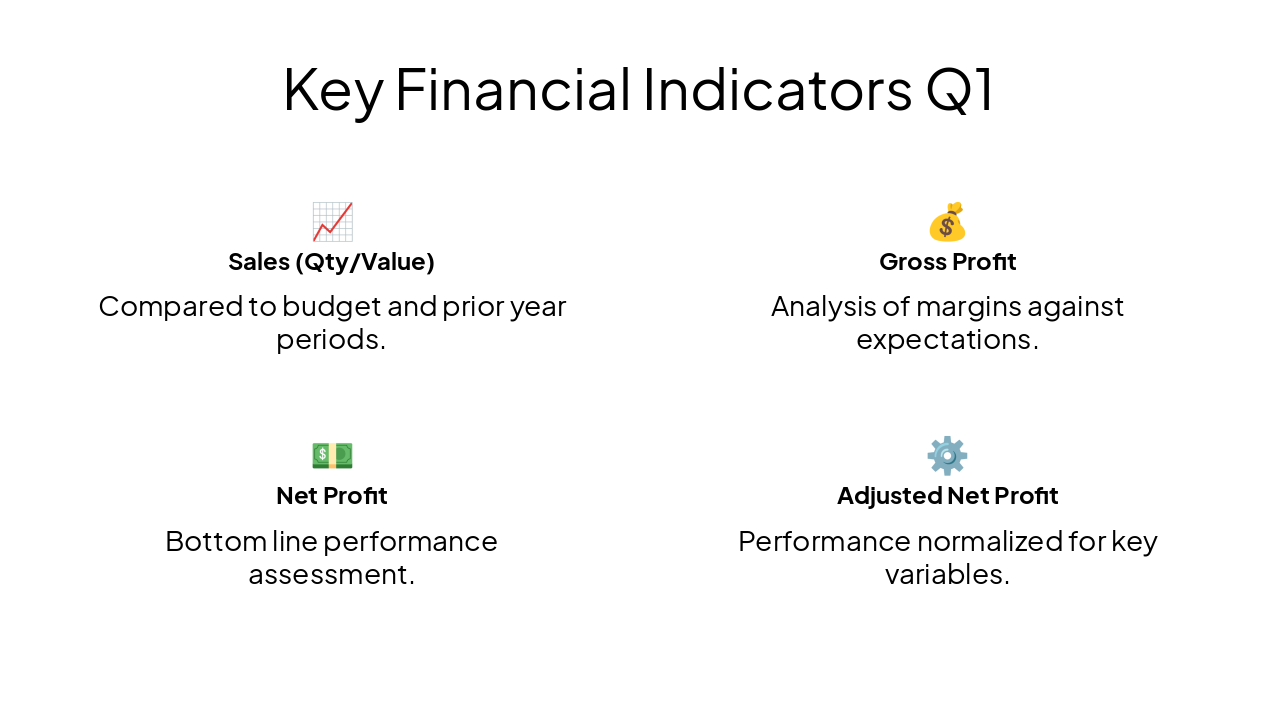
📈 Sales (Qty/Value) Compared to budget and prior year periods.
💰 Gross Profit Analysis of margins against expectations.
💵 Net Profit Bottom line performance assessment.
⚙️ Adjusted Net Profit Performance normalized for key variables.
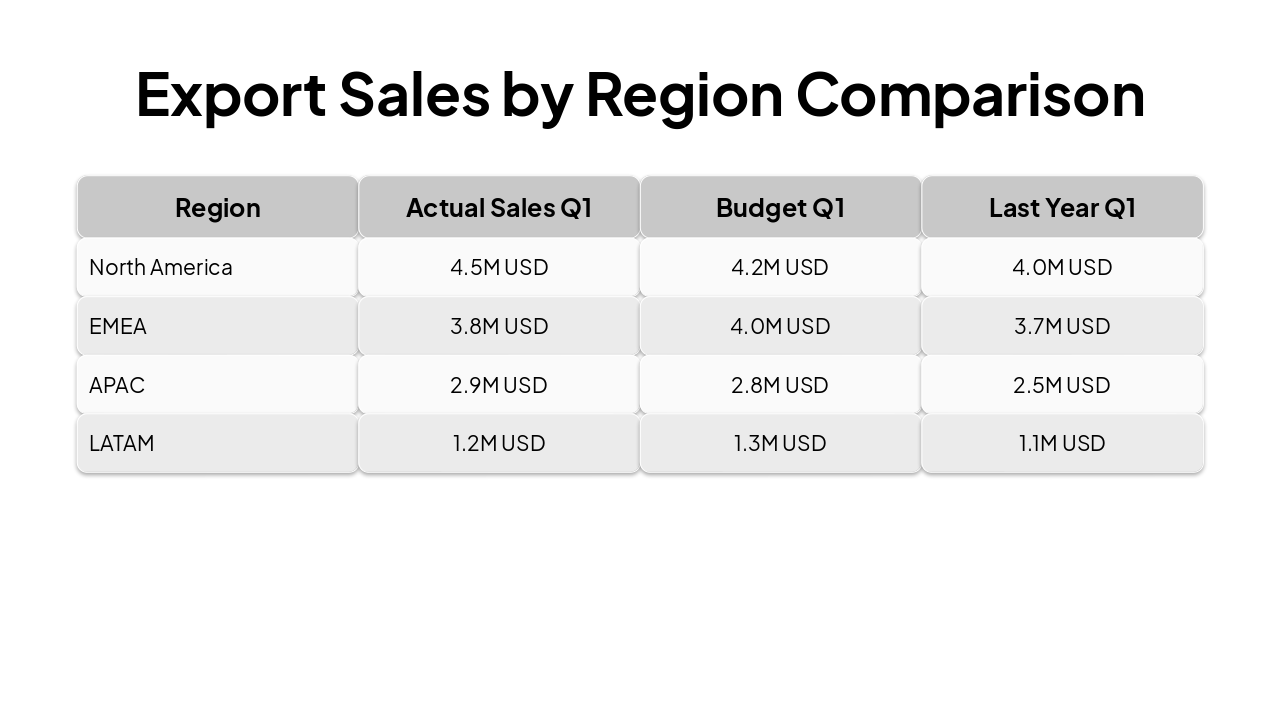
| Region | Actual Sales Q1 | Budget Q1 | Last Year Q1 |
|---|---|---|---|
| North America | 4.5M USD | 4.2M USD | 4.0M USD |
| EMEA | 3.8M USD | 4.0M USD | 3.7M USD |
| APAC | 2.9M USD | 2.8M USD | 2.5M USD |
| LATAM | 1.2M USD | 1.3M USD | 1.1M USD |
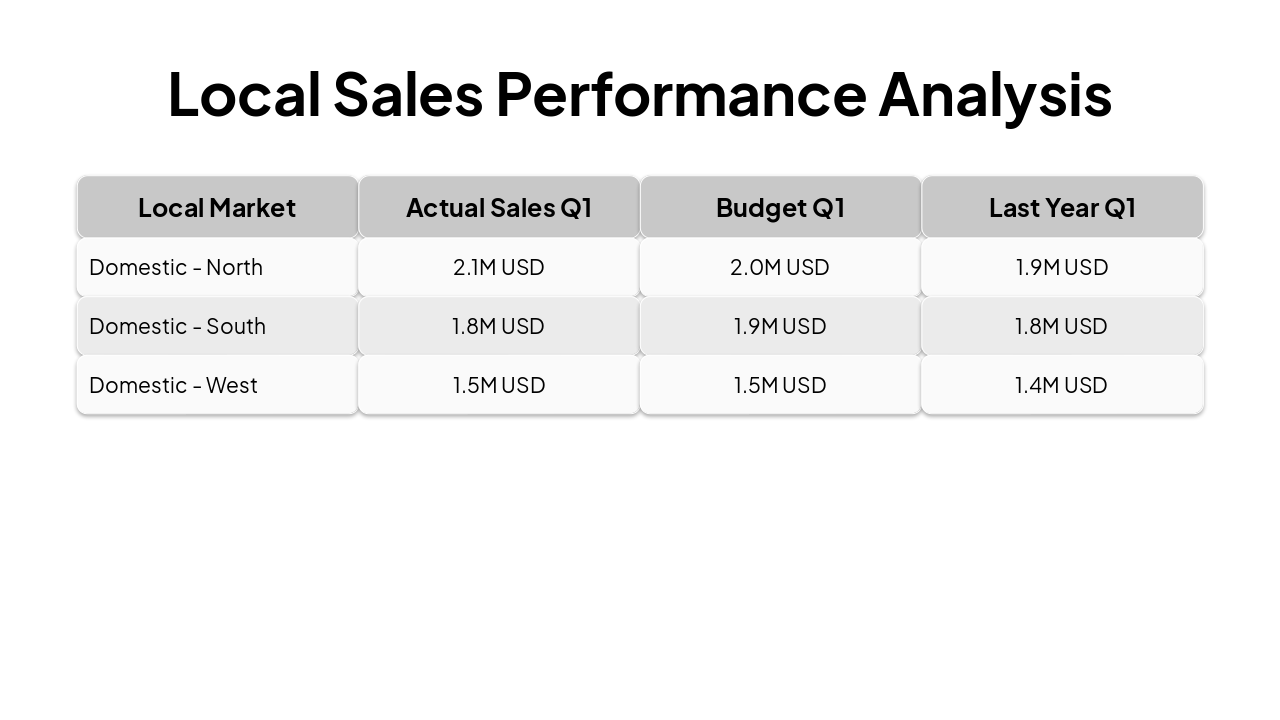
| Local Market | Actual Sales Q1 | Budget Q1 | Last Year Q1 |
|---|---|---|---|
| Domestic - North | 2.1M USD | 2.0M USD | 1.9M USD |
| Domestic - South | 1.8M USD | 1.9M USD | 1.8M USD |
| Domestic - West | 1.5M USD | 1.5M USD | 1.4M USD |
On track to achieve financial targets through disciplined execution.
Q2 2024 Outlook
Explore thousands of AI-generated presentations for inspiration
Generate professional presentations in seconds with Karaf's AI. Customize this presentation or start from scratch.