Beyond Bricks and Mortar: Drivers of India's Economic Growth

Generated from prompt:

Create a stunning, high-impact research defence PowerPoint (30-mark level, premium academic design) based on this dissertation: Title: Beyond Bricks and Mortar — Education Expenditure, Capital Investment and the Drivers of India's Economic Growth (1991–2023) Author: Mahdiya Tasneem Institution: St. Xavier's College, Kolkata Design Theme: - Dark academic + modern minimal (black, deep blue, gold accents) - Clean graphs, bold headings, strong visual hierarchy - Suitable for viva/defence with examiners - Use subtle animations and emphasis on key results Structure (expand to ~14–16 slides): 1. Title slide (premium, elegant) 2. Research motivation (why this matters for India) 3. Literature review (Mallick & Dash 2015) 4. Research gap & contribution (highlight novelty strongly) 5. Data & variables (visual icons + clean layout) 6. Methodology flow (ADF → Johansen → VAR) 7. Unit root results (simple, visual) 8. Cointegration result (rank = 0 explained visually) 9. VAR model overview 10. Key regression results (GDP equation focus) 11. System equations insights (UNEMP, EDU, GCF) 12. Diagnostics (clean credibility slide) 13. Granger causality (highlight 4 key findings boldly) 14. IRF insights (visual storytelling) 15. FEVD results (big numbers, impact) 16. Conclusion & policy implications (exam-ready) 17. Thank you + viva questions Special emphasis: - Highlight: Jobless growth (GDP → UNEMP) - Highlight: GCF → EDU (novel finding) - Highlight: Education is long-run only Make it visually stunning, professional, and worthy of top marks. Use minimal text per slide and strong visual storytelling. Return a downloadable PPT and PDF.

Research defence analyzing education expenditure, capital investment, and unemployment's role in India's GDP growth (1991–2023). Employs VAR models, Granger causality, IRFs, and FEVD to reveal physical capital's short-run dominance, education's long跑

April 17, 202617 slides
Slide 1 of 17

Slide 1 - Research Defence

Beyond Bricks and Mortar

Education Expenditure, Capital Investment, and the Drivers of India's Economic Growth (1991–2023) | Mahdiya Tasneem, St. Xavier's College, Kolkata

---

Photo by Tom Parkes on Unsplash

Slide 1 - Research Defence
Slide 2 of 17

Slide 2 - Research Motivation

  • Shift from protectionist policies to LPG reforms (1991)
  • Critical need to identify sustainable growth drivers
  • Addressing the paradox: High GDP vs. persistent structural issues
  • Evaluating the efficacy of public investment in education vs. physical capital
Slide 2 - Research Motivation
Slide 3 of 17

Slide 3 - Literature Review

  • Mallick & Dash (2015): Analyzed linkages between public expenditure and growth in India
  • Established the role of infrastructure and fiscal policies in long-run development
  • Foundations for understanding structural transformations in transition economies
  • Acknowledged the need for updated analysis incorporating recent post-liberalization data
Slide 3 - Literature Review
Slide 4 of 17

Slide 4 - Research Gap & Contribution

  • Extended temporal scope (up to 2023) to capture post-pandemic dynamics
  • Novel investigation: Direct causality from Gross Capital Formation (GCF) to Education Expenditure
  • Explicit focus on 'Jobless Growth' dynamics within the VAR framework
  • Empirical verification of education as a long-run growth driver exclusively
Slide 4 - Research Gap & Contribution
Slide 5 of 17

Slide 5 - Data & Variables

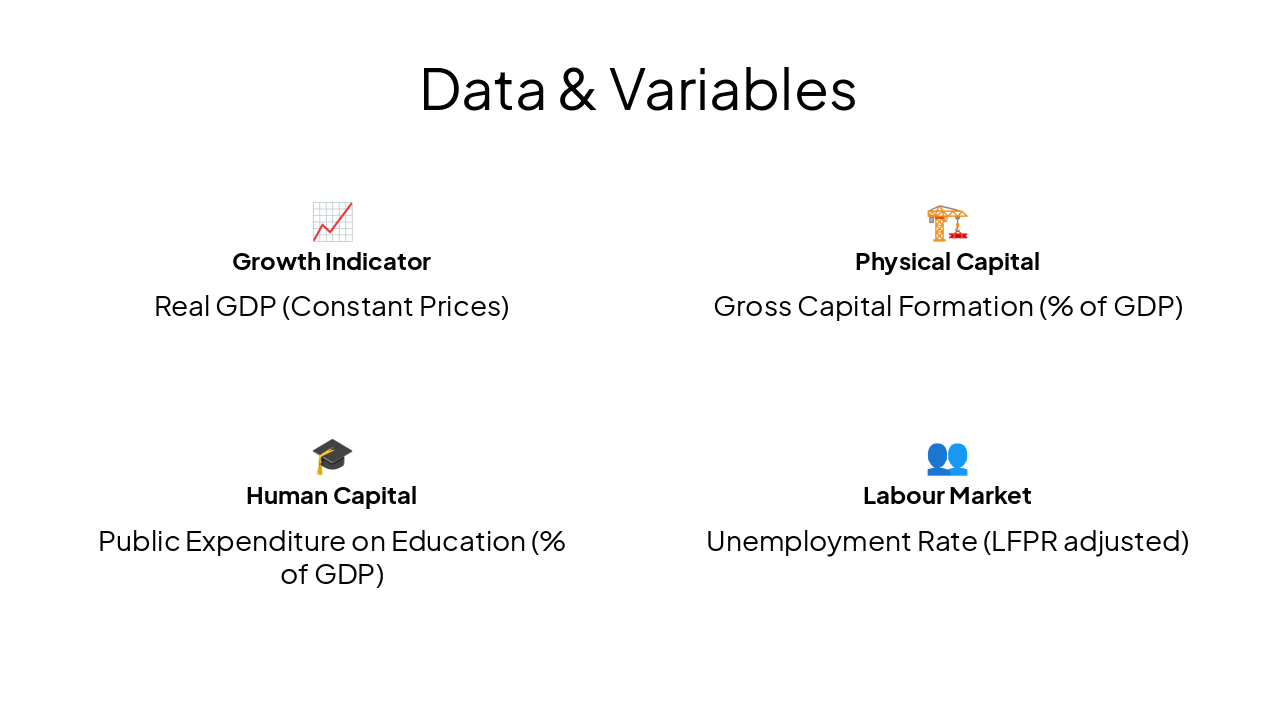
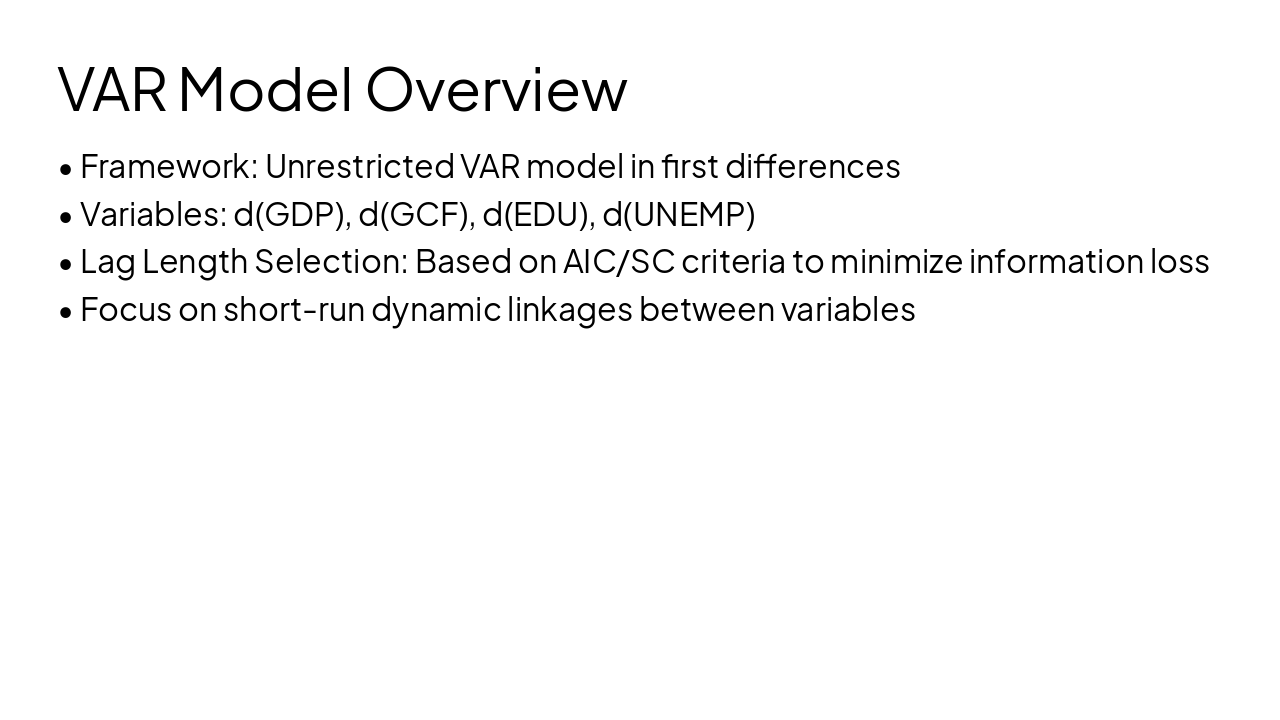
📈 Growth Indicator Real GDP (Constant Prices)

🏗️ Physical Capital Gross Capital Formation (% of GDP)

🎓 Human Capital Public Expenditure on Education (% of GDP)

👥 Labour Market Unemployment Rate (LFPR adjusted)
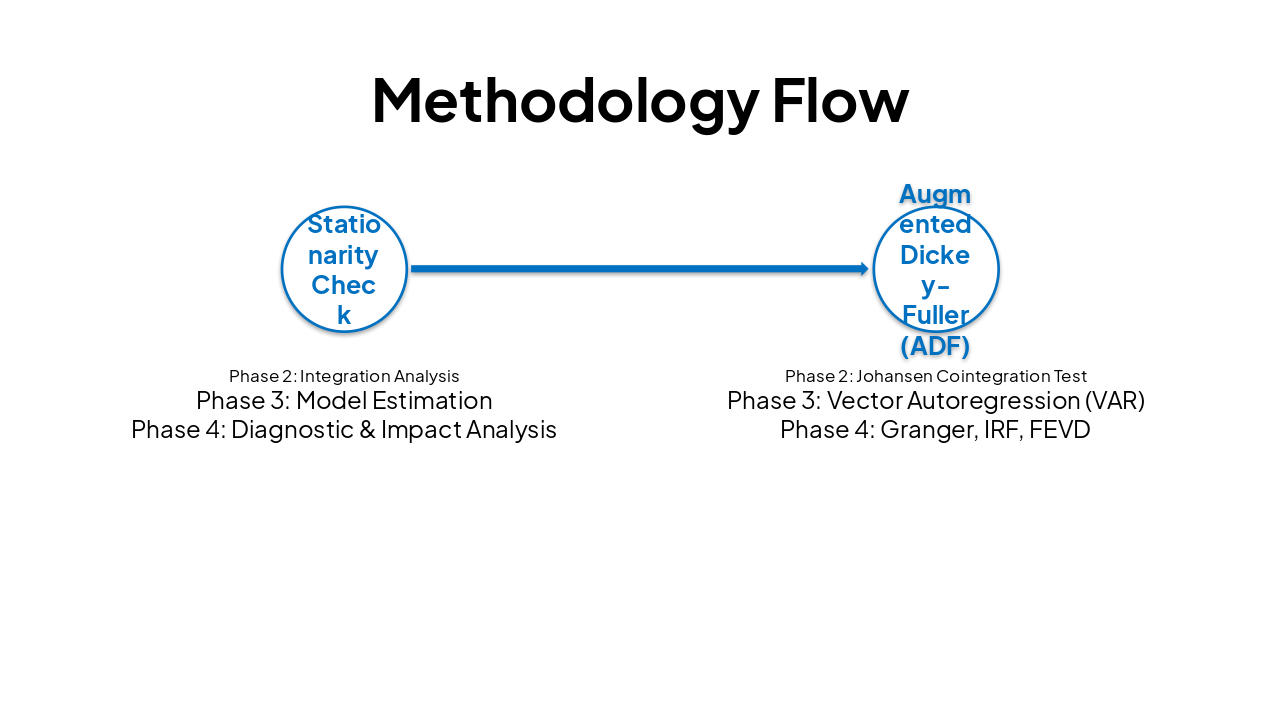
Slide 5 - Data & Variables
Slide 6 of 17

Slide 6 - Methodology Flow

Phase 1Phase 2Phase 3Phase 4
Stationarity CheckIntegration AnalysisModel EstimationDiagnostic & Impact Analysis
Augmented Dickey-Fuller (ADF)Johansen Cointegration TestVector Autoregression (VAR)Granger, IRF, FEVD
Slide 6 - Methodology Flow
Slide 7 of 17

Slide 7 - Unit Root Results

  • 100%: Level Test
  • Stable: First Difference
Slide 7 - Unit Root Results
Slide 8 of 17

Slide 8 - Cointegration Analysis

  • Trace Statistic and Max-Eigenvalue Test utilized
  • Null hypothesis: Rank=0 (No cointegration) failed to be rejected
  • Implication: Lack of long-run equilibrium vector among chosen variables
  • Conclusion: VAR model in first differences is the statistically robust specification
Slide 8 - Cointegration Analysis
Slide 9 of 17

Slide 9 - VAR Model Overview

  • Framework: Unrestricted VAR model in first differences
  • Variables: d(GDP), d(GCF), d(EDU), d(UNEMP)
  • Lag Length Selection: Based on AIC/SC criteria to minimize information loss
  • Focus on short-run dynamic linkages between variables
Slide 9 - VAR Model Overview
Slide 10 of 17

Slide 10 - Key Regression Results (GDP Equation)

  • GDP growth positively influenced by lagged GCF (Physical Capital)
  • Education Expenditure shows negligible short-run impact on GDP
  • Evidence of Jobless Growth: GDP growth coefficients positively associated with UNEMP changes
  • Model R-squared indicates robust explanatory power for the period
Slide 10 - Key Regression Results (GDP Equation)
Slide 11 of 17

Slide 11 - System Equations Insights

  • GCF → EDU: Statistically significant positive feedback loop identified
  • UNEMP: Relatively insensitive to short-run shocks in EDU spending
  • EDU: Confirmed as a long-run determinant rather than a short-run policy lever
  • Capital formation remains the dominant driver of short-term industrial expansion
Slide 11 - System Equations Insights
Slide 12 of 17

Slide 12 - Diagnostics & Credibility

  • Stability Condition: All roots reside within the unit circle (Stable VAR)
  • Serial Correlation: Breusch-Godfrey test indicates no evidence of autocorrelation
  • Heteroskedasticity: White test confirms residual constant variance
  • Normality: Residuals demonstrate multivariate normality (Jarque-Bera)
Slide 12 - Diagnostics & Credibility
Slide 13 of 17

Slide 13 - Granger Causality Highlights

  • GDP → UNEMP: Strong evidence of structural Jobless Growth
  • GCF → EDU: Novel proof of Physical Investment driving Education capacity
  • EDU → GDP: Insignificant Granger causality in the short run
  • GCF → GDP: Primary driver of industrial acceleration confirmed
Slide 13 - Granger Causality Highlights
Slide 14 of 17

Slide 14 - IRF Insights: Visualizing Shocks

  • Shock to GCF leads to sustained positive impact on GDP
  • Response of UNEMP to GDP shocks remains stubbornly positive (Jobless Growth)
  • Delayed response of output to education expenditure fluctuations

---

Photo by Arturo Añez on Unsplash

Slide 14 - IRF Insights: Visualizing Shocks
Slide 15 of 17

Slide 15 - FEVD: Variance Decomposition Results

  • 42%: GCF Impact
  • 28%: GCF Influence
  • < 5%: Edu Contribution
Slide 15 - FEVD: Variance Decomposition Results
Slide 16 of 17

Slide 16 - Conclusion & Policy

Conclusion: Beyond Bricks and Mortar

Policy: Prioritize physical infrastructure in short term; rethink education integration for long-term employability.

Slide 16 - Conclusion & Policy
Slide 17 of 17

Slide 17 - Defence Conclusion

Thank You

Thank you for your time. Ready for examiner questions.

---

Photo by Nastuh Abootalebi on Unsplash

Slide 17 - Defence Conclusion

Discover More Presentations

Explore thousands of AI-generated presentations for inspiration

Browse Presentations
Powered by AI

Create Your Own Presentation

Generate professional presentations in seconds with Karaf's AI. Customize this presentation or start from scratch.

Create New Presentation

Powered by Karaf.ai — AI-Powered Presentation Generator